| Red | Green | Blue | |
| z | 17.64 | ||
| znorm | Inf | ||
| sky | -Inf | -Inf | -Inf |
| S/N | 23.4 | 42.2 | 46.1 |
| S/N(c) | 0.0 | 0.0 | 0.0 |
| SN(E/C) |
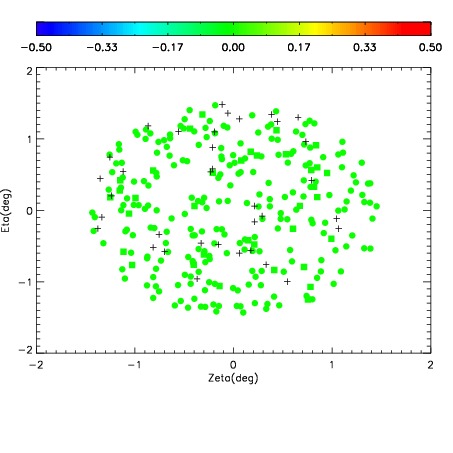
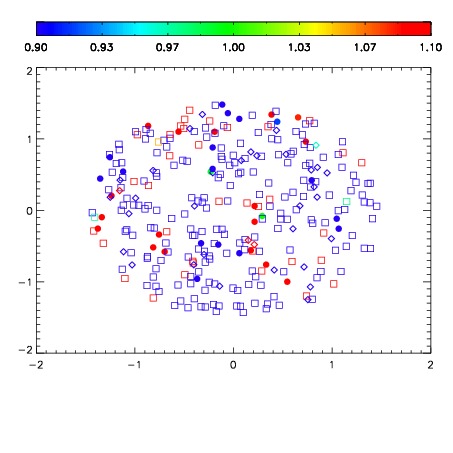
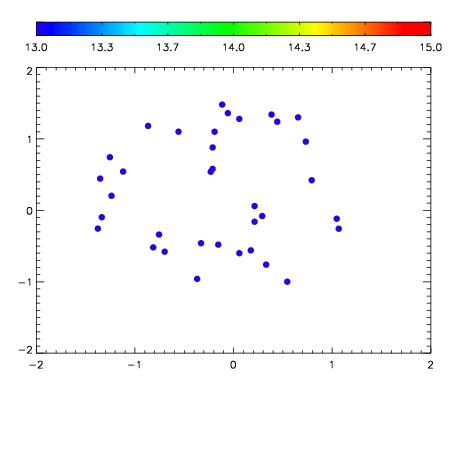

| Frame | Nreads | Zeropoints | Mag plots | Spatial mag deviation | Spatial sky 16325A emission deviations (filled: sky, open: star) | Spatial sky continuum emission | Spatial sky telluric CO2 absorption deviations (filled: H < 10) | |||||||||||||||||||||||
| 0 | 0 |
|
|
|
|
|
|
| IPAIR | NAME | SHIFT | NEWSHIFT | S/N | NAME | SHIFT | NEWSHIFT | S/N |
| 0 | 11120050 | 0.479322 | 0.00000 | 18.8278 | 11120048 | 0.00000 | 0.479322 | 18.8385 |
| 1 | 11120054 | 0.478771 | 0.000550985 | 18.9461 | 11120055 | -0.00392924 | 0.483251 | 18.9292 |
| 2 | 11120053 | 0.477356 | 0.00196600 | 18.9341 | 11120052 | -0.00320700 | 0.482529 | 18.9021 |
| 3 | 11120049 | 0.478969 | 0.000352979 | 18.8052 | 11120051 | -0.00325830 | 0.482580 | 18.8380 |