| Red | Green | Blue | |
| z | 17.64 | ||
| znorm | Inf | ||
| sky | -Inf | -Inf | -Inf |
| S/N | 18.9 | 31.8 | 35.0 |
| S/N(c) | 0.0 | 0.0 | 0.0 |
| SN(E/C) |
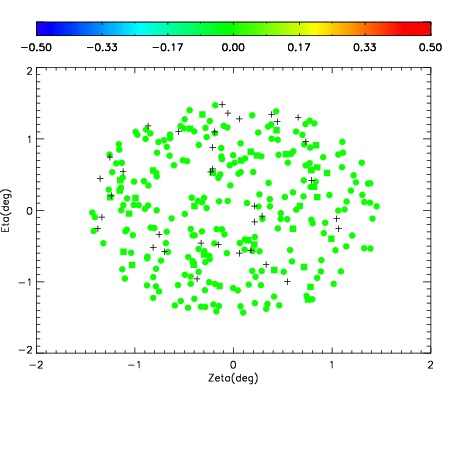
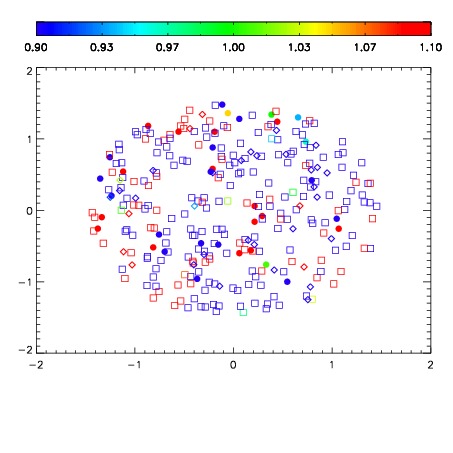
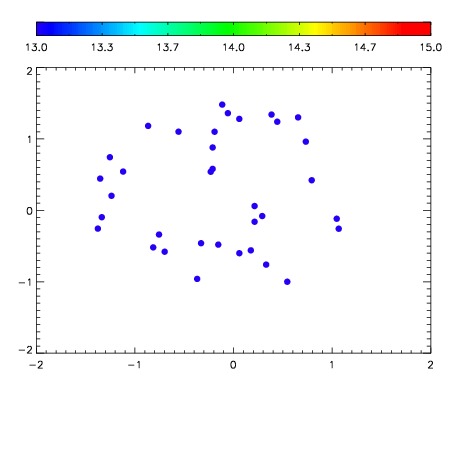

| Frame | Nreads | Zeropoints | Mag plots | Spatial mag deviation | Spatial sky 16325A emission deviations (filled: sky, open: star) | Spatial sky continuum emission | Spatial sky telluric CO2 absorption deviations (filled: H < 10) | |||||||||||||||||||||||
| 0 | 0 |
|
|
|
|
|
|
| IPAIR | NAME | SHIFT | NEWSHIFT | S/N | NAME | SHIFT | NEWSHIFT | S/N |
| 0 | 11390035 | 0.468243 | 0.00000 | 18.7504 | 11390040 | -0.00186064 | 0.470104 | 18.7185 |
| 1 | 11390034 | 0.467427 | 0.000816017 | 18.9535 | 11390033 | 0.00000 | 0.468243 | 18.9149 |
| 2 | 11390039 | 0.467299 | 0.000943989 | 18.5828 | 11390036 | -0.00138147 | 0.469624 | 18.6669 |
| 3 | 11390038 | 0.466608 | 0.00163502 | 18.5543 | 11390037 | -0.000361614 | 0.468605 | 18.6483 |