| Red | Green | Blue | |
| z | 17.64 | ||
| znorm | Inf | ||
| sky | -Inf | -Inf | -Inf |
| S/N | 14.3 | 27.8 | 28.1 |
| S/N(c) | 0.0 | 0.0 | 0.0 |
| SN(E/C) |
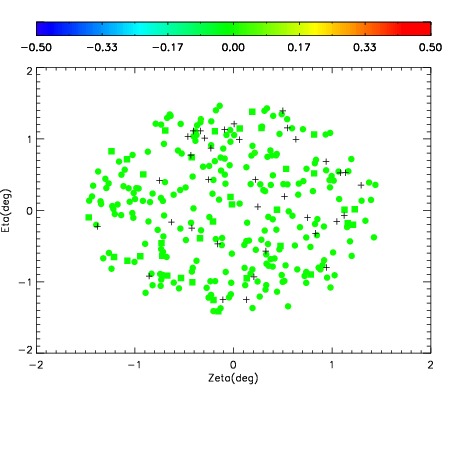
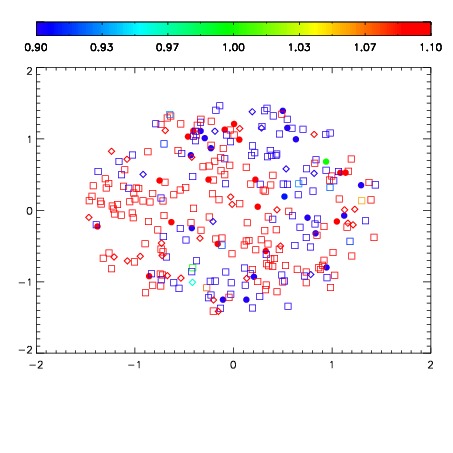
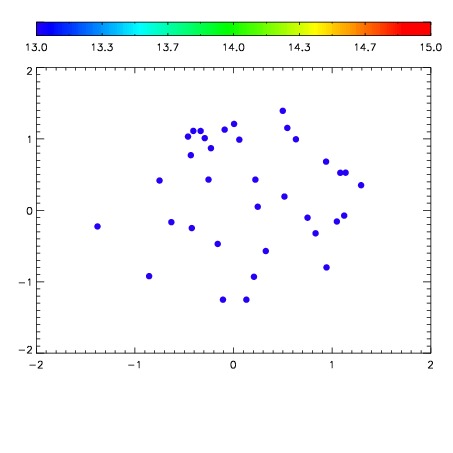

| Frame | Nreads | Zeropoints | Mag plots | Spatial mag deviation | Spatial sky 16325A emission deviations (filled: sky, open: star) | Spatial sky continuum emission | Spatial sky telluric CO2 absorption deviations (filled: H < 10) | |||||||||||||||||||||||
| 0 | 0 |
|
|
|
|
|
|
| IPAIR | NAME | SHIFT | NEWSHIFT | S/N | NAME | SHIFT | NEWSHIFT | S/N |
| 0 | 11160030 | 0.485126 | 0.00000 | 18.2801 | 11160031 | 0.00127929 | 0.483847 | 18.3742 |
| 1 | 11160029 | 0.484205 | 0.000920981 | 18.0925 | 11160028 | 0.000551284 | 0.484575 | 18.3510 |
| 2 | 11160026 | 0.484586 | 0.000539988 | 18.0395 | 11160027 | 0.000783457 | 0.484343 | 18.0954 |
| 3 | 11160025 | 0.483671 | 0.00145498 | 17.9973 | 11160024 | 0.00000 | 0.485126 | 17.7660 |