| Red | Green | Blue | |
| z | 17.64 | ||
| znorm | Inf | ||
| sky | -Inf | -Inf | -NaN |
| S/N | 20.3 | 36.5 | 37.9 |
| S/N(c) | 0.0 | 0.0 | 0.0 |
| SN(E/C) |
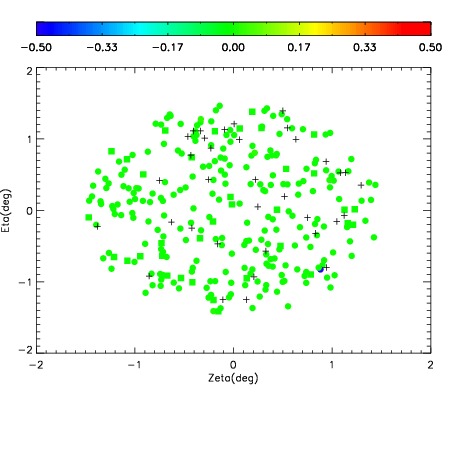
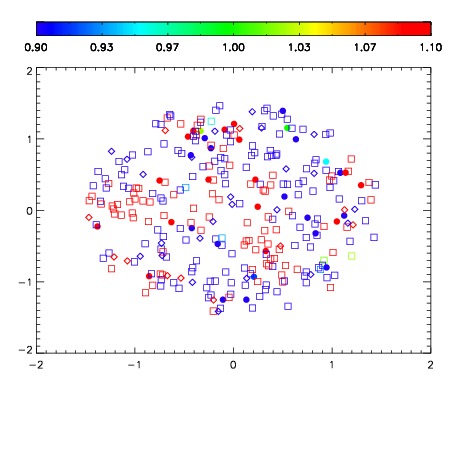
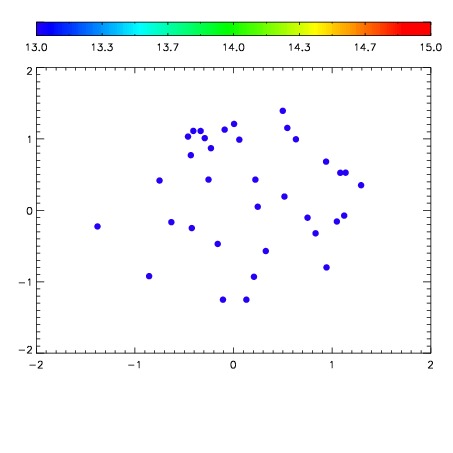

| Frame | Nreads | Zeropoints | Mag plots | Spatial mag deviation | Spatial sky 16325A emission deviations (filled: sky, open: star) | Spatial sky continuum emission | Spatial sky telluric CO2 absorption deviations (filled: H < 10) | |||||||||||||||||||||||
| 0 | 0 |
|
|
|
|
|
|
| IPAIR | NAME | SHIFT | NEWSHIFT | S/N | NAME | SHIFT | NEWSHIFT | S/N |
| 0 | 11170058 | 0.481920 | 0.00000 | 18.6801 | 11170060 | -0.00288689 | 0.484807 | 18.6755 |
| 1 | 11170057 | 0.481055 | 0.000865012 | 18.7868 | 11170059 | -0.00198431 | 0.483904 | 18.6841 |
| 2 | 11170061 | 0.480860 | 0.00106001 | 18.5101 | 11170056 | 0.00000 | 0.481920 | 18.6510 |
| 3 | 11170062 | 0.480300 | 0.00161999 | 18.4932 | 11170063 | -0.00236297 | 0.484283 | 18.4525 |