| Red | Green | Blue | |
| z | 17.64 | ||
| znorm | Inf | ||
| sky | -Inf | -Inf | -Inf |
| S/N | 18.6 | 33.8 | 35.4 |
| S/N(c) | 0.0 | 0.0 | 0.0 |
| SN(E/C) |
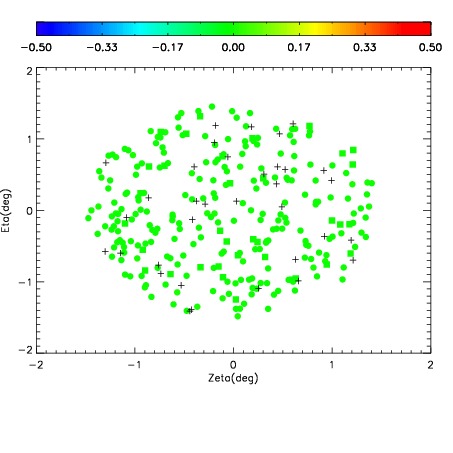
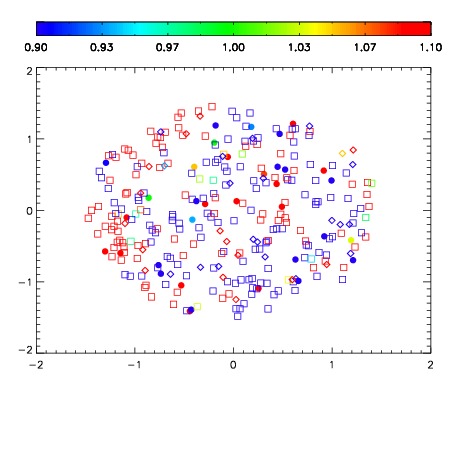


| Frame | Nreads | Zeropoints | Mag plots | Spatial mag deviation | Spatial sky 16325A emission deviations (filled: sky, open: star) | Spatial sky continuum emission | Spatial sky telluric CO2 absorption deviations (filled: H < 10) | |||||||||||||||||||||||
| 0 | 0 |
|
|
|
|
|
|
| IPAIR | NAME | SHIFT | NEWSHIFT | S/N | NAME | SHIFT | NEWSHIFT | S/N |
| 0 | 10890091 | 0.505361 | 0.00000 | 17.8005 | 10890092 | -0.00287123 | 0.508232 | 18.1773 |
| 1 | 10890086 | 0.503299 | 0.00206202 | 18.9859 | 10890085 | 0.00000 | 0.505361 | 19.0782 |
| 2 | 10890087 | 0.503725 | 0.00163603 | 18.5287 | 10890089 | -0.00415779 | 0.509519 | 18.4498 |
| 3 | 10890090 | 0.505282 | 7.90358e-05 | 18.0246 | 10890088 | -0.00399824 | 0.509359 | 18.1834 |