| Red | Green | Blue | |
| z | 17.64 | ||
| znorm | Inf | ||
| sky | -Inf | -Inf | -Inf |
| S/N | 22.1 | 38.0 | 39.7 |
| S/N(c) | 0.0 | 0.0 | 0.0 |
| SN(E/C) |

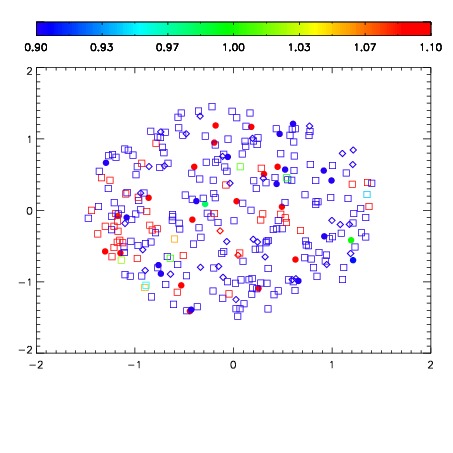
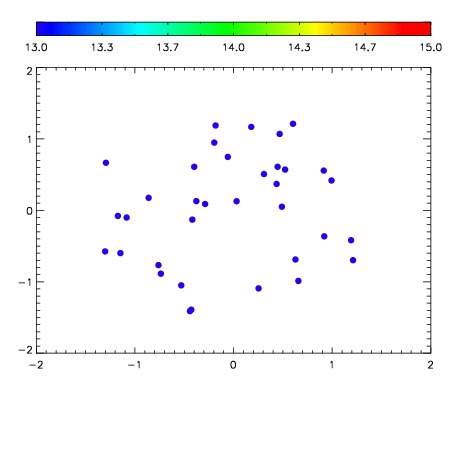

| Frame | Nreads | Zeropoints | Mag plots | Spatial mag deviation | Spatial sky 16325A emission deviations (filled: sky, open: star) | Spatial sky continuum emission | Spatial sky telluric CO2 absorption deviations (filled: H < 10) | |||||||||||||||||||||||
| 0 | 0 |
|
|
|
|
|
|
| IPAIR | NAME | SHIFT | NEWSHIFT | S/N | NAME | SHIFT | NEWSHIFT | S/N |
| 0 | 11050016 | 0.483804 | 0.00000 | 18.6599 | 11050018 | -0.00239397 | 0.486198 | 18.6923 |
| 1 | 11050021 | 0.480855 | 0.00294900 | 18.8638 | 11050019 | -0.00260110 | 0.486405 | 18.8484 |
| 2 | 11050020 | 0.480510 | 0.00329399 | 18.8490 | 11050022 | -0.00351974 | 0.487324 | 18.7568 |
| 3 | 11050017 | 0.482963 | 0.000840992 | 18.5672 | 11050015 | 0.00000 | 0.483804 | 17.8273 |