| Red | Green | Blue | |
| z | 17.64 | ||
| znorm | Inf | ||
| sky | -NaN | -NaN | -Inf |
| S/N | 28.9 | 49.8 | 52.9 |
| S/N(c) | 0.0 | 0.0 | 0.0 |
| SN(E/C) |
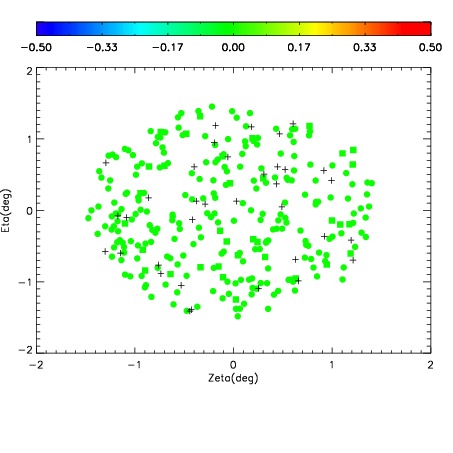
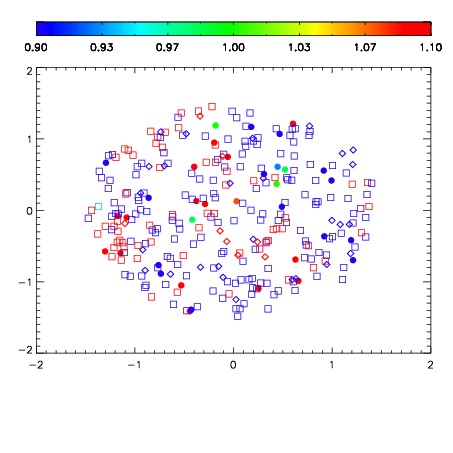
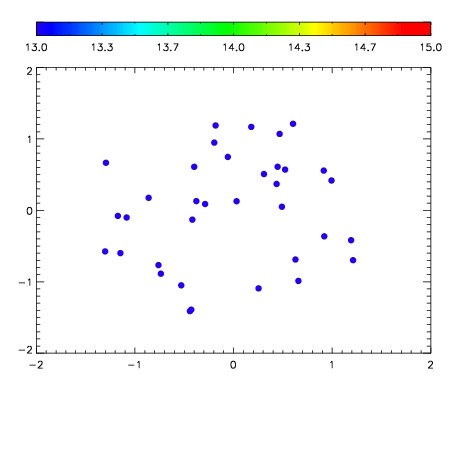

| Frame | Nreads | Zeropoints | Mag plots | Spatial mag deviation | Spatial sky 16325A emission deviations (filled: sky, open: star) | Spatial sky continuum emission | Spatial sky telluric CO2 absorption deviations (filled: H < 10) | |||||||||||||||||||||||
| 0 | 0 |
|
|
|
|
|
|
| IPAIR | NAME | SHIFT | NEWSHIFT | S/N | NAME | SHIFT | NEWSHIFT | S/N |
| 0 | 11350049 | 0.477340 | 0.00000 | 19.1732 | 11350050 | -0.000130302 | 0.477470 | 19.1640 |
| 1 | 11350045 | 0.476462 | 0.000878006 | 19.1832 | 11350046 | -0.00103998 | 0.478380 | 19.1753 |
| 2 | 11350048 | 0.477046 | 0.000294000 | 19.1696 | 11350047 | -0.000509016 | 0.477849 | 19.1628 |
| 3 | 11350044 | 0.474924 | 0.00241601 | 19.1529 | 11350043 | 0.00000 | 0.477340 | 19.1351 |