| Red | Green | Blue | |
| z | 17.64 | ||
| znorm | Inf | ||
| sky | -Inf | -Inf | -NaN |
| S/N | 13.4 | 25.1 | 27.0 |
| S/N(c) | 0.0 | 0.0 | 0.0 |
| SN(E/C) |
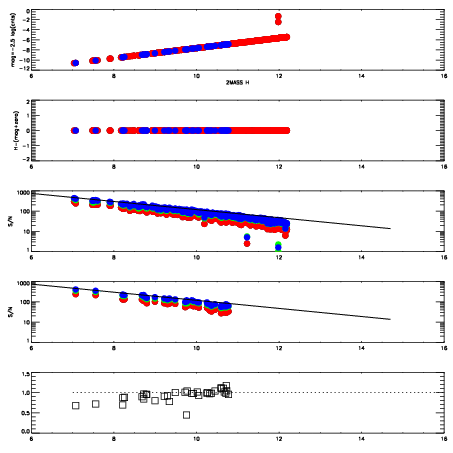
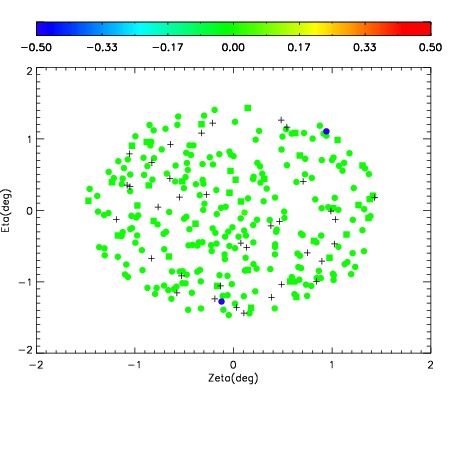
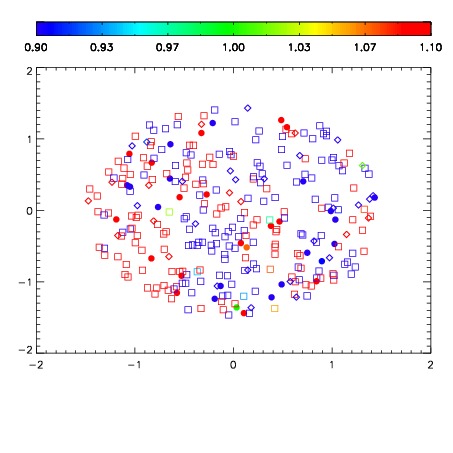
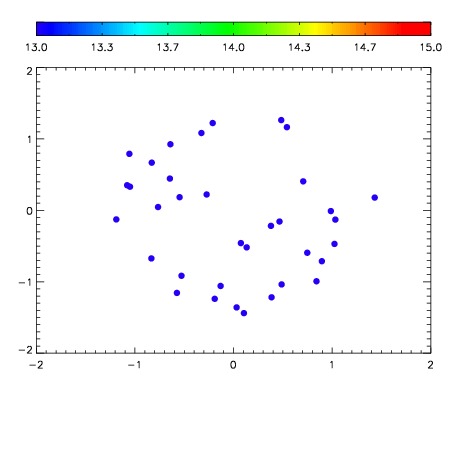

| Frame | Nreads | Zeropoints | Mag plots | Spatial mag deviation | Spatial sky 16325A emission deviations (filled: sky, open: star) | Spatial sky continuum emission | Spatial sky telluric CO2 absorption deviations (filled: H < 10) | |||||||||||||||||||||||
| 0 | 0 |
|
|
|
|
|
|
| IPAIR | NAME | SHIFT | NEWSHIFT | S/N | NAME | SHIFT | NEWSHIFT | S/N |
| 0 | 11170069 | 0.483053 | 0.00000 | 18.0126 | 11170074 | -0.00396808 | 0.487021 | 18.1630 |
| 1 | 11170068 | 0.483029 | 2.39909e-05 | 18.3037 | 11170070 | -0.00332350 | 0.486376 | 18.3016 |
| 2 | 11170073 | 0.481409 | 0.00164399 | 18.0308 | 11170067 | 0.00000 | 0.483053 | 18.1948 |
| 3 | 11170072 | 0.481631 | 0.00142199 | 17.8004 | 11170071 | -0.00285158 | 0.485905 | 17.9092 |