| Red | Green | Blue | |
| z | 17.64 | ||
| znorm | Inf | ||
| sky | -Inf | -NaN | -Inf |
| S/N | 19.9 | 35.8 | 39.0 |
| S/N(c) | 0.0 | 0.0 | 0.0 |
| SN(E/C) |
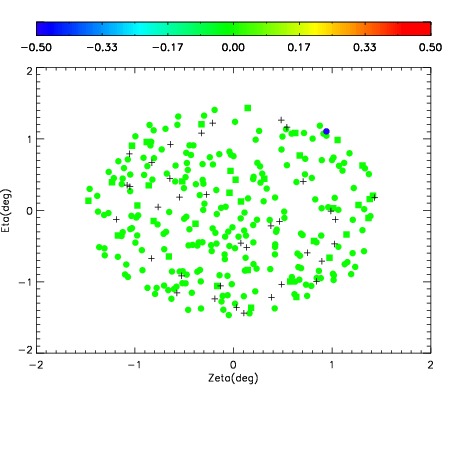
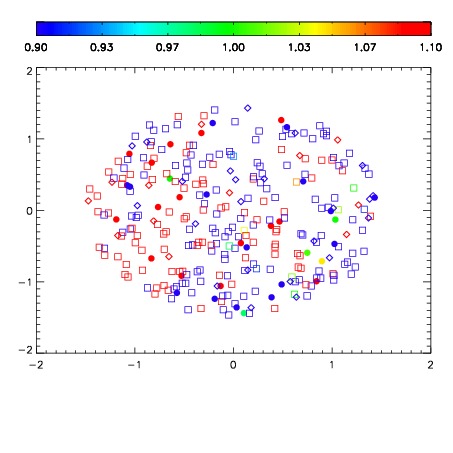
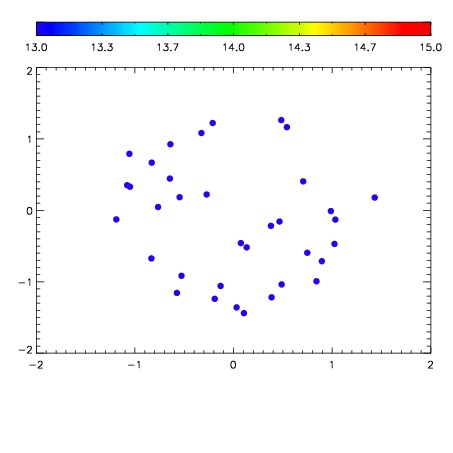

| Frame | Nreads | Zeropoints | Mag plots | Spatial mag deviation | Spatial sky 16325A emission deviations (filled: sky, open: star) | Spatial sky continuum emission | Spatial sky telluric CO2 absorption deviations (filled: H < 10) | |||||||||||||||||||||||
| 0 | 0 |
|
|
|
|
|
|
| IPAIR | NAME | SHIFT | NEWSHIFT | S/N | NAME | SHIFT | NEWSHIFT | S/N |
| 0 | 11640041 | 0.494259 | 0.00000 | 18.6375 | 11640046 | 0.000980223 | 0.493279 | 18.6990 |
| 1 | 11640040 | 0.493569 | 0.000690013 | 18.6497 | 11640039 | 0.00000 | 0.494259 | 18.7126 |
| 2 | 11640045 | 0.494247 | 1.20103e-05 | 18.5424 | 11640042 | 0.00159096 | 0.492668 | 18.6070 |
| 3 | 11640044 | 0.493233 | 0.00102600 | 18.4423 | 11640043 | 0.00163578 | 0.492623 | 18.5464 |