| Red | Green | Blue | |
| z | 17.64 | ||
| znorm | Inf | ||
| sky | -Inf | -Inf | -Inf |
| S/N | 27.5 | 47.0 | 50.5 |
| S/N(c) | 0.0 | 0.0 | 0.0 |
| SN(E/C) |
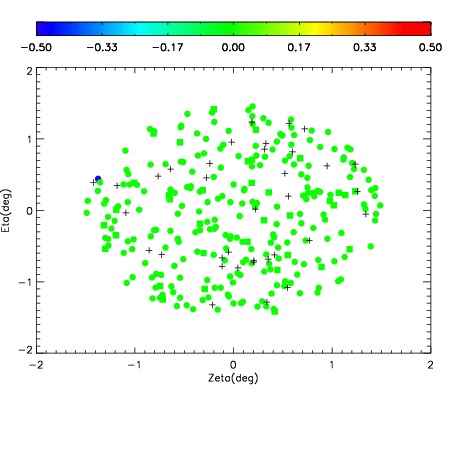
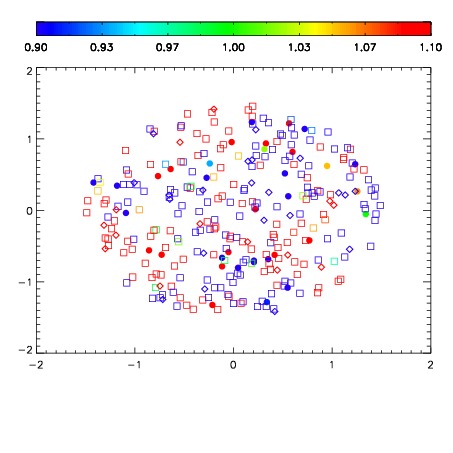
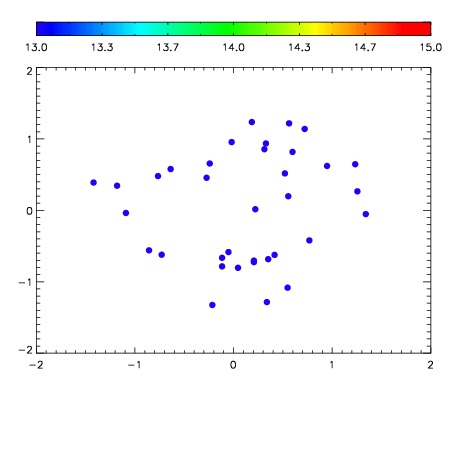

| Frame | Nreads | Zeropoints | Mag plots | Spatial mag deviation | Spatial sky 16325A emission deviations (filled: sky, open: star) | Spatial sky continuum emission | Spatial sky telluric CO2 absorption deviations (filled: H < 10) | |||||||||||||||||||||||
| 0 | 0 |
|
|
|
|
|
|
| IPAIR | NAME | SHIFT | NEWSHIFT | S/N | NAME | SHIFT | NEWSHIFT | S/N |
| 0 | 11140078 | 0.481621 | 0.00000 | 19.1842 | 11140076 | -0.00117767 | 0.482799 | 19.1657 |
| 1 | 11140077 | 0.480692 | 0.000928998 | 19.1960 | 11140079 | -0.00210583 | 0.483727 | 19.1796 |
| 2 | 11140073 | 0.479106 | 0.00251499 | 19.1461 | 11140072 | 0.00000 | 0.481621 | 19.1441 |
| 3 | 11140074 | 0.480261 | 0.00136000 | 19.1269 | 11140075 | -0.00158314 | 0.483204 | 19.1285 |