| Red | Green | Blue | |
| z | 17.64 | ||
| znorm | Inf | ||
| sky | -NaN | -NaN | -NaN |
| S/N | 18.7 | 33.9 | 35.2 |
| S/N(c) | 0.0 | 0.0 | 0.0 |
| SN(E/C) |
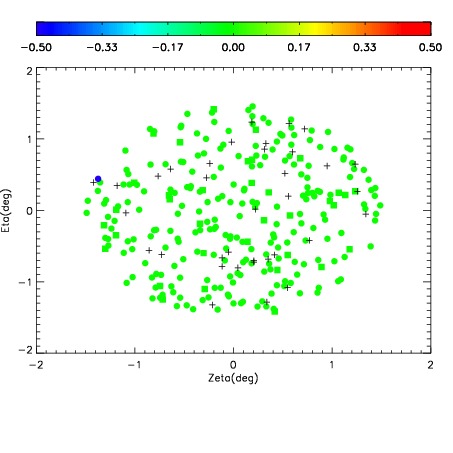
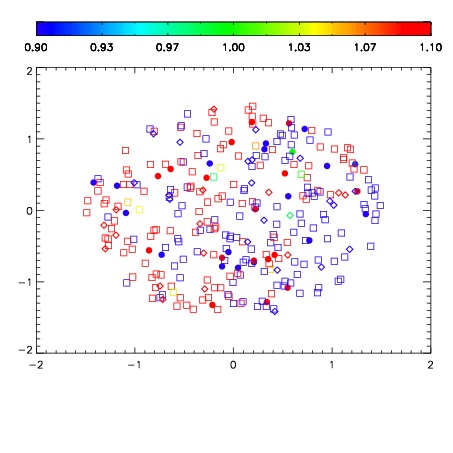


| Frame | Nreads | Zeropoints | Mag plots | Spatial mag deviation | Spatial sky 16325A emission deviations (filled: sky, open: star) | Spatial sky continuum emission | Spatial sky telluric CO2 absorption deviations (filled: H < 10) | |||||||||||||||||||||||
| 0 | 0 |
|
|
|
|
|
|
| IPAIR | NAME | SHIFT | NEWSHIFT | S/N | NAME | SHIFT | NEWSHIFT | S/N |
| 0 | 11180013 | 0.480212 | 0.00000 | 18.3925 | 11180011 | 0.00000 | 0.480212 | 17.5768 |
| 1 | 11180016 | 0.478000 | 0.00221202 | 18.7777 | 11180015 | -0.00293143 | 0.483143 | 18.7417 |
| 2 | 11180012 | 0.478994 | 0.00121799 | 18.6458 | 11180018 | -0.00134997 | 0.481562 | 18.6123 |
| 3 | 11180017 | 0.478764 | 0.00144801 | 18.6247 | 11180014 | -0.00311652 | 0.483329 | 18.4904 |