| Red | Green | Blue | |
| z | 17.64 | ||
| znorm | Inf | ||
| sky | -Inf | -Inf | -Inf |
| S/N | 3.6 | 7.1 | 7.4 |
| S/N(c) | 0.0 | 0.0 | 0.0 |
| SN(E/C) |
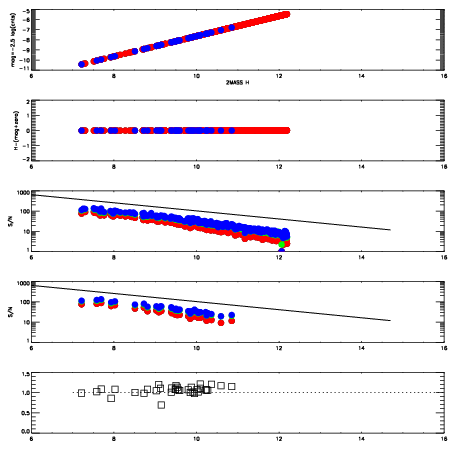
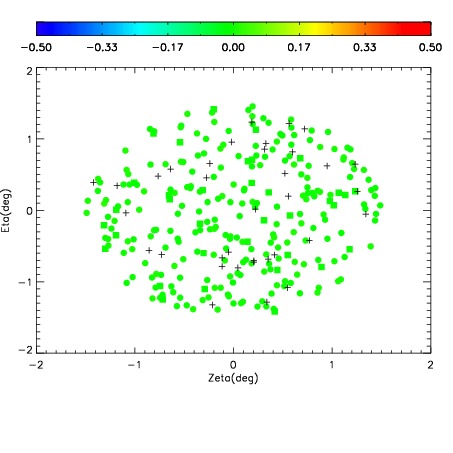
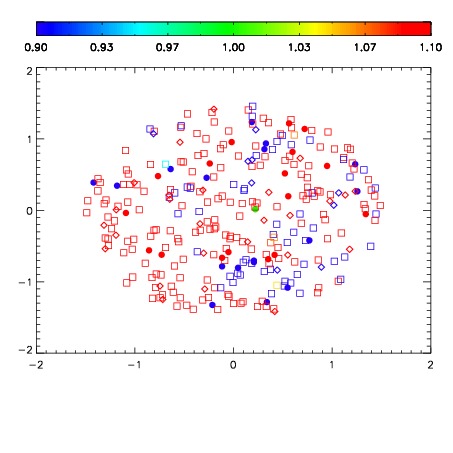
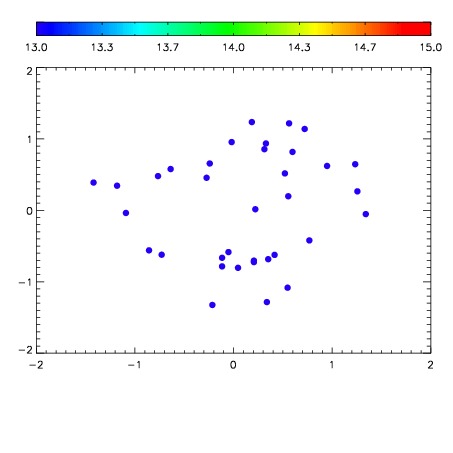

| Frame | Nreads | Zeropoints | Mag plots | Spatial mag deviation | Spatial sky 16325A emission deviations (filled: sky, open: star) | Spatial sky continuum emission | Spatial sky telluric CO2 absorption deviations (filled: H < 10) | |||||||||||||||||||||||
| 0 | 0 |
|
|
|
|
|
|
| IPAIR | NAME | SHIFT | NEWSHIFT | S/N | NAME | SHIFT | NEWSHIFT | S/N |
| 0 | 11660043 | 0.496517 | 0.00000 | 16.7197 | 11660044 | -0.00491689 | 0.501434 | 17.5436 |
| 1 | 11660046 | 0.494658 | 0.00185901 | 16.2757 | 11660045 | -0.00464226 | 0.501159 | 16.8231 |
| 2 | 11660047 | 0.495278 | 0.00123900 | 15.7954 | 11660048 | -0.00493319 | 0.501450 | 15.5389 |