| Red | Green | Blue | |
| z | 17.64 | ||
| znorm | Inf | ||
| sky | -Inf | -Inf | -NaN |
| S/N | 4.0 | 9.2 | 9.0 |
| S/N(c) | 0.0 | 0.0 | 0.0 |
| SN(E/C) |
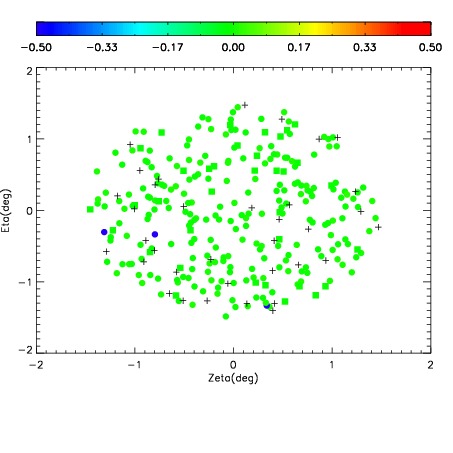
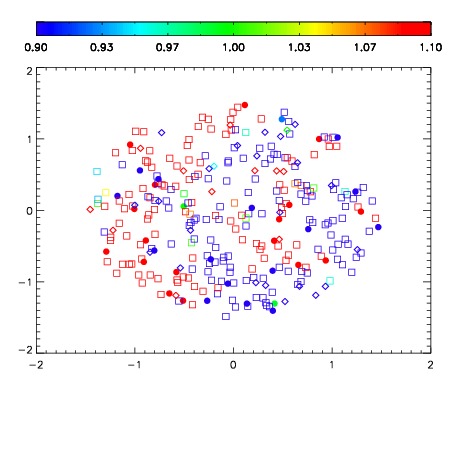
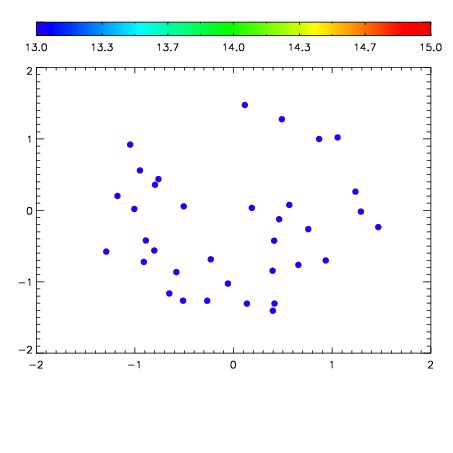

| Frame | Nreads | Zeropoints | Mag plots | Spatial mag deviation | Spatial sky 16325A emission deviations (filled: sky, open: star) | Spatial sky continuum emission | Spatial sky telluric CO2 absorption deviations (filled: H < 10) | |||||||||||||||||||||||
| 0 | 0 |
|
|
|
|
|
|
| IPAIR | NAME | SHIFT | NEWSHIFT | S/N | NAME | SHIFT | NEWSHIFT | S/N |
| 0 | 10930056 | 0.513215 | 0.00000 | 13.5908 | 10930061 | -0.000577237 | 0.513792 | 14.7618 |
| 1 | 10930051 | 0.511275 | 0.00194001 | 17.2859 | 10930050 | 0.00000 | 0.513215 | 17.2034 |
| 2 | 10930052 | 0.512575 | 0.000640035 | 16.4465 | 10930053 | -0.000240128 | 0.513455 | 16.7635 |
| 3 | 10930055 | 0.512479 | 0.000735998 | 14.9904 | 10930054 | 0.000250749 | 0.512964 | 15.7297 |