| Red | Green | Blue | |
| z | 17.64 | ||
| znorm | Inf | ||
| sky | -Inf | -Inf | -Inf |
| S/N | 23.9 | 43.1 | 45.2 |
| S/N(c) | 0.0 | 0.0 | 0.0 |
| SN(E/C) |
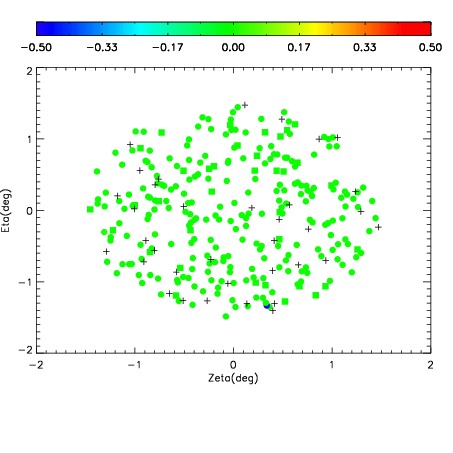
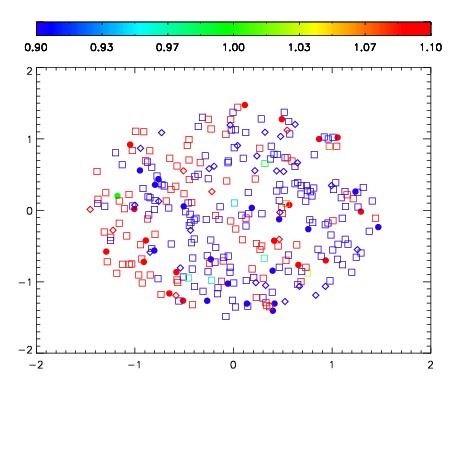
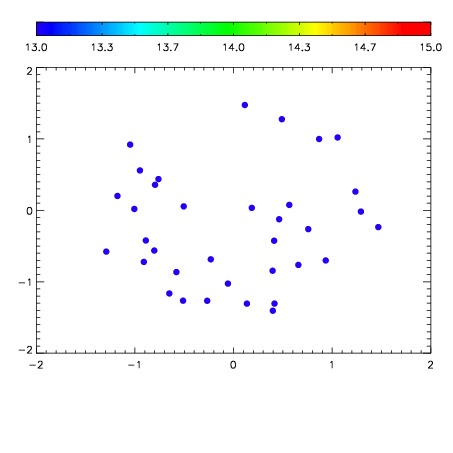

| Frame | Nreads | Zeropoints | Mag plots | Spatial mag deviation | Spatial sky 16325A emission deviations (filled: sky, open: star) | Spatial sky continuum emission | Spatial sky telluric CO2 absorption deviations (filled: H < 10) | |||||||||||||||||||||||
| 0 | 0 |
|
|
|
|
|
|
| IPAIR | NAME | SHIFT | NEWSHIFT | S/N | NAME | SHIFT | NEWSHIFT | S/N |
| 0 | 10940067 | 0.515435 | 0.00000 | 18.9150 | 10940064 | -0.00440260 | 0.519838 | 18.9273 |
| 1 | 10940066 | 0.514900 | 0.000534952 | 18.9376 | 10940068 | -0.00332198 | 0.518757 | 18.9341 |
| 2 | 10940063 | 0.515209 | 0.000225961 | 18.8198 | 10940061 | 0.00000 | 0.515435 | 18.9094 |
| 3 | 10940062 | 0.513992 | 0.00144297 | 18.8165 | 10940065 | -0.00385871 | 0.519294 | 18.9085 |