| Red | Green | Blue | |
| z | 17.64 | ||
| znorm | Inf | ||
| sky | -Inf | -NaN | -Inf |
| S/N | 25.3 | 44.9 | 47.9 |
| S/N(c) | 0.0 | 0.0 | 0.0 |
| SN(E/C) |
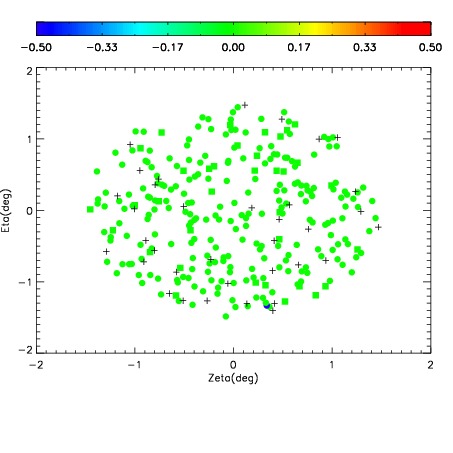
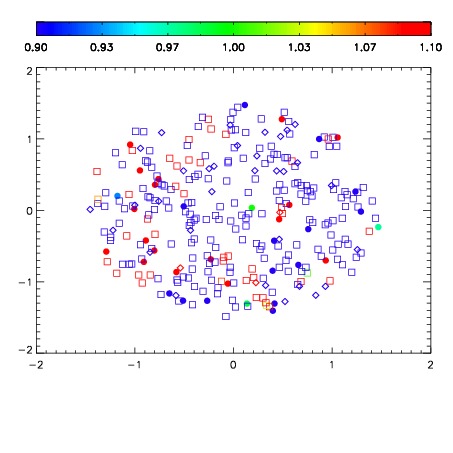
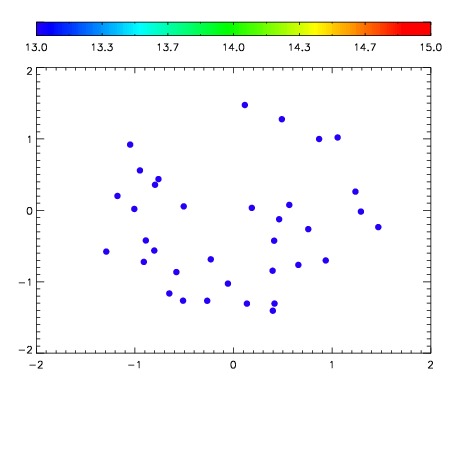

| Frame | Nreads | Zeropoints | Mag plots | Spatial mag deviation | Spatial sky 16325A emission deviations (filled: sky, open: star) | Spatial sky continuum emission | Spatial sky telluric CO2 absorption deviations (filled: H < 10) | |||||||||||||||||||||||
| 0 | 0 |
|
|
|
|
|
|
| IPAIR | NAME | SHIFT | NEWSHIFT | S/N | NAME | SHIFT | NEWSHIFT | S/N |
| 0 | 11110072 | 0.473615 | 0.00000 | 19.0028 | 11110073 | -0.00339898 | 0.477014 | 18.9672 |
| 1 | 11110071 | 0.472140 | 0.00147498 | 19.0506 | 11110070 | 0.00000 | 0.473615 | 19.0820 |
| 2 | 11110075 | 0.472686 | 0.000928998 | 18.8498 | 11110074 | -0.00407938 | 0.477694 | 18.9667 |
| 3 | 11110076 | 0.473349 | 0.000265986 | 18.7312 | 11110077 | -0.00372318 | 0.477338 | 18.7253 |