| Red | Green | Blue | |
| z | 17.64 | ||
| znorm | Inf | ||
| sky | -NaN | -Inf | -Inf |
| S/N | 24.4 | 42.7 | 46.2 |
| S/N(c) | 0.0 | 0.0 | 0.0 |
| SN(E/C) |
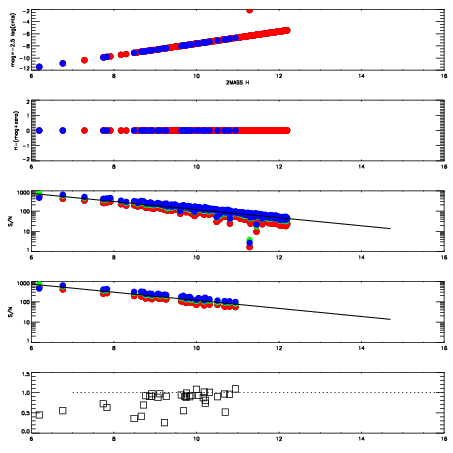
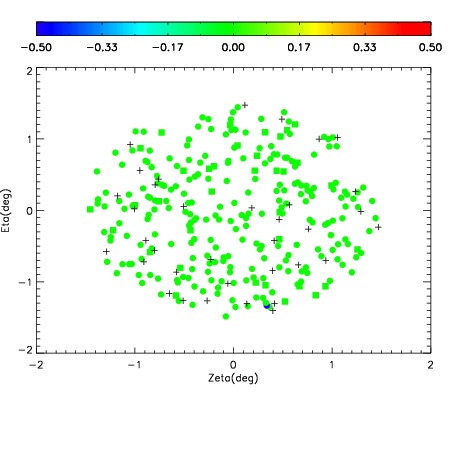
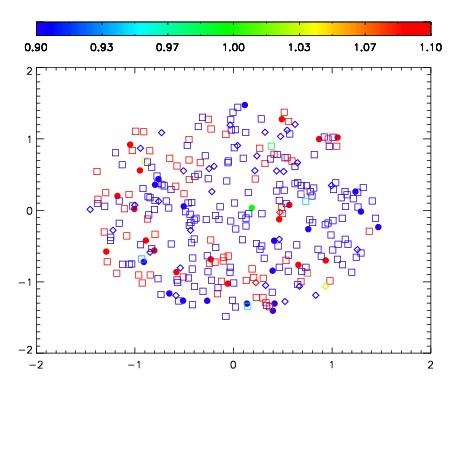
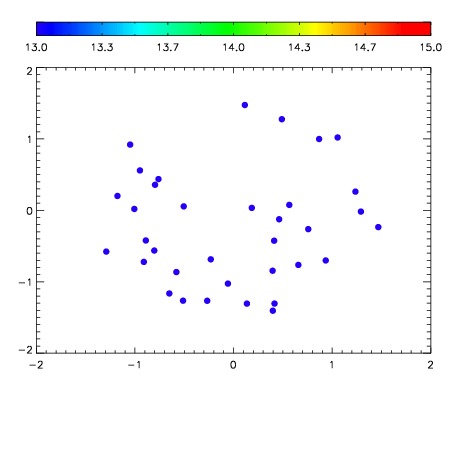

| Frame | Nreads | Zeropoints | Mag plots | Spatial mag deviation | Spatial sky 16325A emission deviations (filled: sky, open: star) | Spatial sky continuum emission | Spatial sky telluric CO2 absorption deviations (filled: H < 10) | |||||||||||||||||||||||
| 0 | 0 |
|
|
|
|
|
|
| IPAIR | NAME | SHIFT | NEWSHIFT | S/N | NAME | SHIFT | NEWSHIFT | S/N |
| 0 | 11120072 | 0.479028 | 0.00000 | 18.9365 | 11120073 | -0.00292640 | 0.481954 | 19.0161 |
| 1 | 11120075 | 0.476770 | 0.00225797 | 18.9916 | 11120074 | -0.00243836 | 0.481466 | 19.0506 |
| 2 | 11120076 | 0.477528 | 0.00149998 | 18.8057 | 11120077 | -0.000243257 | 0.479271 | 18.7544 |
| 3 | 11120071 | 0.478473 | 0.000554979 | 18.7986 | 11120070 | 0.00000 | 0.479028 | 18.7202 |