| Red | Green | Blue | |
| z | 17.64 | ||
| znorm | Inf | ||
| sky | -Inf | -Inf | -Inf |
| S/N | 21.3 | 38.1 | 40.2 |
| S/N(c) | 0.0 | 0.0 | 0.0 |
| SN(E/C) |
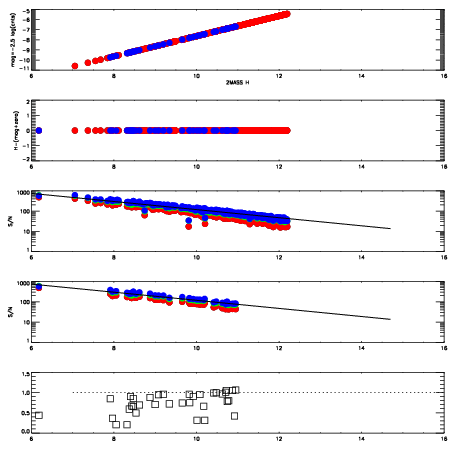
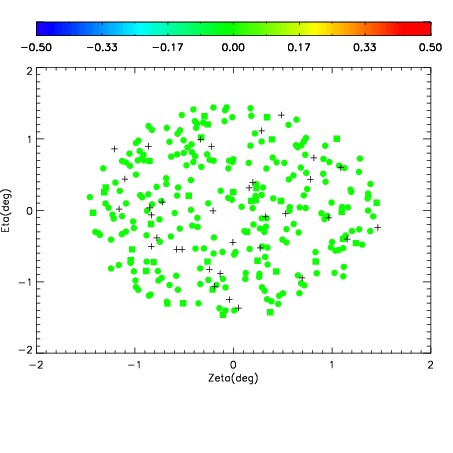
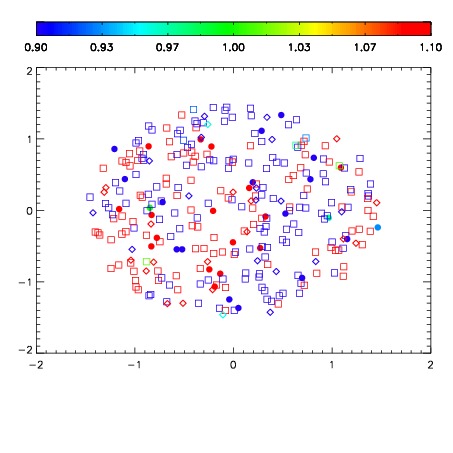
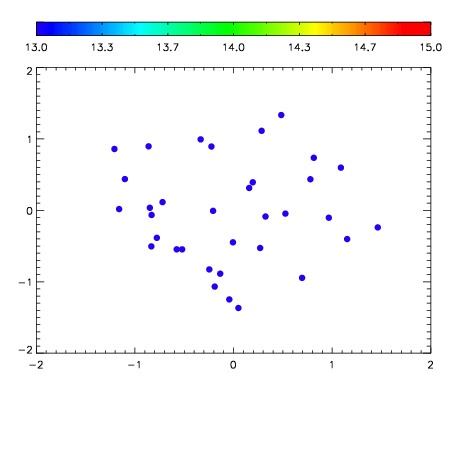

| Frame | Nreads | Zeropoints | Mag plots | Spatial mag deviation | Spatial sky 16325A emission deviations (filled: sky, open: star) | Spatial sky continuum emission | Spatial sky telluric CO2 absorption deviations (filled: H < 10) | |||||||||||||||||||||||
| 0 | 0 |
|
|
|
|
|
|
| IPAIR | NAME | SHIFT | NEWSHIFT | S/N | NAME | SHIFT | NEWSHIFT | S/N |
| 0 | 10910072 | 0.508078 | 0.00000 | 18.5288 | 10910073 | -0.00366397 | 0.511742 | 18.6183 |
| 1 | 10910067 | 0.507487 | 0.000590980 | 18.9426 | 10910069 | -0.00333538 | 0.511413 | 18.7847 |
| 2 | 10910068 | 0.507002 | 0.00107598 | 18.8597 | 10910066 | 0.00000 | 0.508078 | 18.6889 |
| 3 | 10910071 | 0.507999 | 7.89762e-05 | 18.5361 | 10910070 | -0.00317036 | 0.511248 | 18.6568 |