| Red | Green | Blue | |
| z | 17.64 | ||
| znorm | Inf | ||
| sky | -Inf | -Inf | -Inf |
| S/N | 17.9 | 32.4 | 34.5 |
| S/N(c) | 0.0 | 0.0 | 0.0 |
| SN(E/C) |
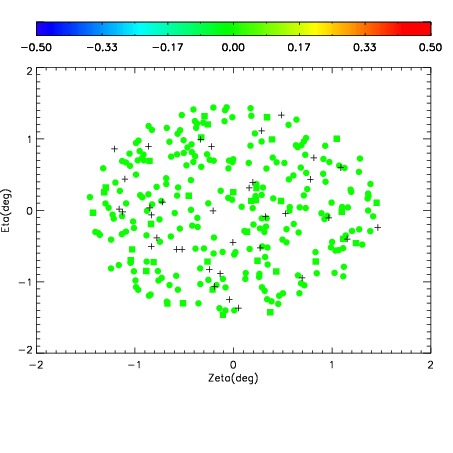
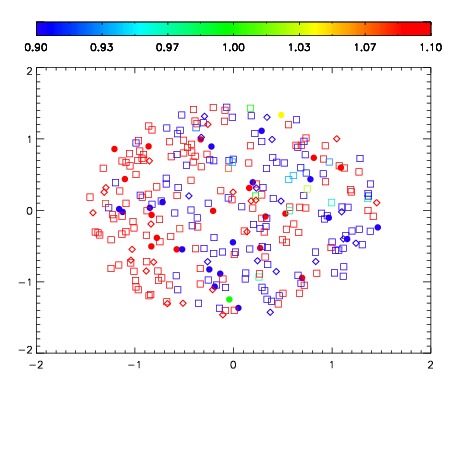
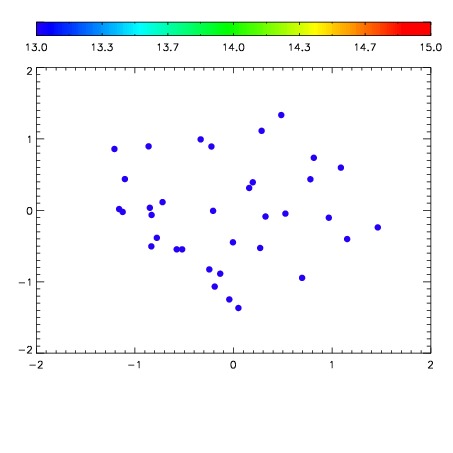

| Frame | Nreads | Zeropoints | Mag plots | Spatial mag deviation | Spatial sky 16325A emission deviations (filled: sky, open: star) | Spatial sky continuum emission | Spatial sky telluric CO2 absorption deviations (filled: H < 10) | |||||||||||||||||||||||
| 0 | 0 |
|
|
|
|
|
|
| IPAIR | NAME | SHIFT | NEWSHIFT | S/N | NAME | SHIFT | NEWSHIFT | S/N |
| 0 | 11670012 | 0.497727 | 0.00000 | 18.3762 | 11670013 | -0.00226370 | 0.499991 | 18.1343 |
| 1 | 11670011 | 0.496884 | 0.000843018 | 18.7658 | 11670010 | 0.00000 | 0.497727 | 18.7091 |
| 2 | 11670016 | 0.494210 | 0.00351700 | 18.3940 | 11670017 | -0.00459805 | 0.502325 | 18.4602 |
| 3 | 11670015 | 0.494690 | 0.00303701 | 18.1884 | 11670014 | -0.00295635 | 0.500683 | 18.1300 |