| Red | Green | Blue | |
| z | 17.64 | ||
| znorm | Inf | ||
| sky | -Inf | -Inf | -Inf |
| S/N | 29.6 | 49.5 | 51.5 |
| S/N(c) | 0.0 | 0.0 | 0.0 |
| SN(E/C) |
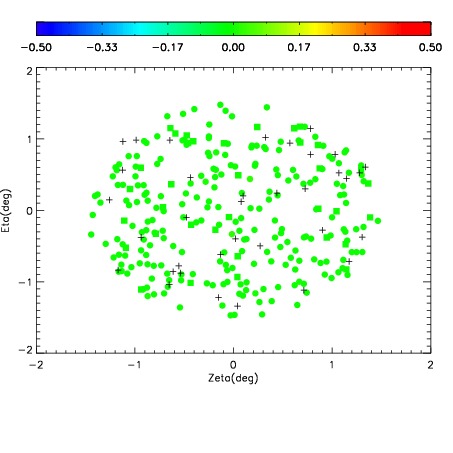
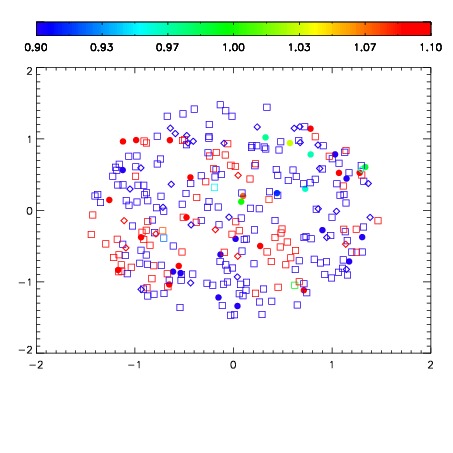


| Frame | Nreads | Zeropoints | Mag plots | Spatial mag deviation | Spatial sky 16325A emission deviations (filled: sky, open: star) | Spatial sky continuum emission | Spatial sky telluric CO2 absorption deviations (filled: H < 10) | |||||||||||||||||||||||
| 0 | 0 |
|
|
|
|
|
|
| IPAIR | NAME | SHIFT | NEWSHIFT | S/N | NAME | SHIFT | NEWSHIFT | S/N |
| 0 | 11140067 | 0.480722 | 0.00000 | 19.1125 | 11140061 | 0.00000 | 0.480722 | 19.0866 |
| 1 | 11140062 | 0.475438 | 0.00528401 | 19.1439 | 11140068 | -0.000644820 | 0.481367 | 19.1512 |
| 2 | 11140063 | 0.476644 | 0.00407800 | 19.1397 | 11140065 | -0.00190351 | 0.482626 | 19.1287 |
| 3 | 11140066 | 0.480342 | 0.000380009 | 19.1253 | 11140064 | -0.00231616 | 0.483038 | 19.1164 |