| Red | Green | Blue | |
| z | 17.64 | ||
| znorm | Inf | ||
| sky | -Inf | -Inf | -Inf |
| S/N | 28.7 | 46.7 | 51.3 |
| S/N(c) | 0.0 | 0.0 | 0.0 |
| SN(E/C) |
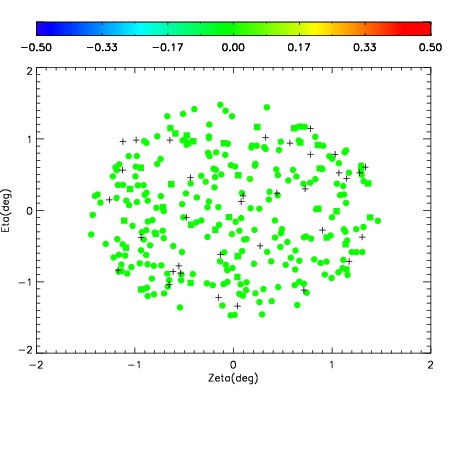
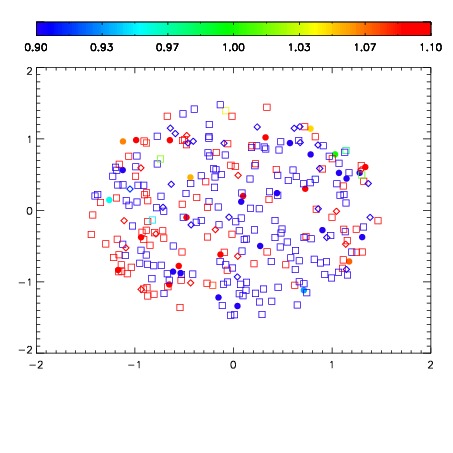
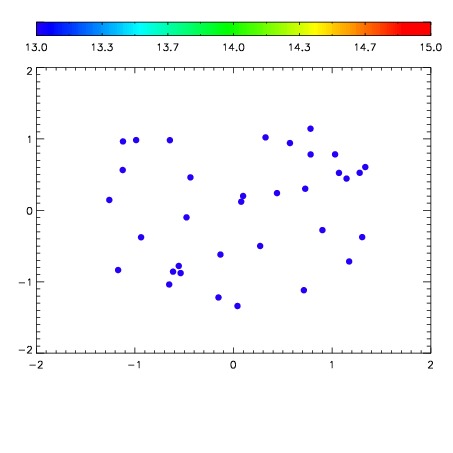

| Frame | Nreads | Zeropoints | Mag plots | Spatial mag deviation | Spatial sky 16325A emission deviations (filled: sky, open: star) | Spatial sky continuum emission | Spatial sky telluric CO2 absorption deviations (filled: H < 10) | |||||||||||||||||||||||
| 0 | 0 |
|
|
|
|
|
|
| IPAIR | NAME | SHIFT | NEWSHIFT | S/N | NAME | SHIFT | NEWSHIFT | S/N |
| 0 | 11970017 | 0.499335 | 0.00000 | 18.9942 | 11970018 | -0.00117532 | 0.500510 | 18.9521 |
| 1 | 11970012 | 0.498786 | 0.000548989 | 19.1742 | 11970011 | 0.00000 | 0.499335 | 19.1747 |
| 2 | 11970013 | 0.498585 | 0.000750005 | 19.1461 | 11970014 | -0.00304103 | 0.502376 | 19.1429 |
| 3 | 11970016 | 0.498489 | 0.000845999 | 19.1124 | 11970015 | -0.00299148 | 0.502326 | 19.1044 |