| Red | Green | Blue | |
| z | 17.64 | ||
| znorm | Inf | ||
| sky | -Inf | -Inf | -NaN |
| S/N | 30.3 | 47.7 | 44.9 |
| S/N(c) | 0.0 | 0.0 | 0.0 |
| SN(E/C) |
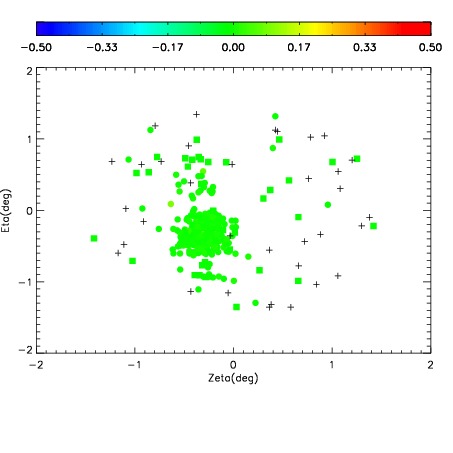
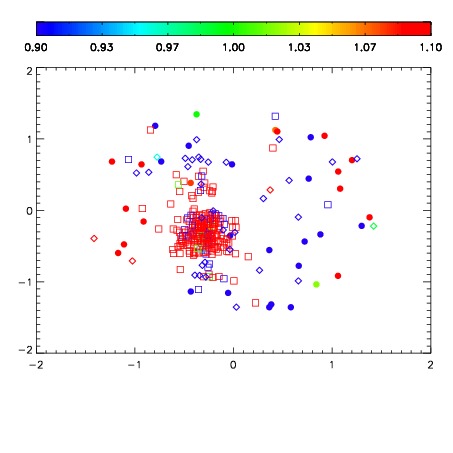


| Frame | Nreads | Zeropoints | Mag plots | Spatial mag deviation | Spatial sky 16325A emission deviations (filled: sky, open: star) | Spatial sky continuum emission | Spatial sky telluric CO2 absorption deviations (filled: H < 10) | |||||||||||||||||||||||
| 0 | 0 |
|
|
|
|
|
|
| IPAIR | NAME | SHIFT | NEWSHIFT | S/N | NAME | SHIFT | NEWSHIFT | S/N |
| 0 | 10440054 | 0.513072 | 0.00000 | 19.0347 | 10440056 | 0.00866692 | 0.504405 | 19.0757 |
| 1 | 10440050 | 0.509131 | 0.00394100 | 19.1131 | 10440049 | 0.00000 | 0.513072 | 19.1308 |
| 2 | 10440051 | 0.509968 | 0.00310403 | 19.0990 | 10440053 | 0.00872136 | 0.504351 | 19.0922 |
| 3 | 10440055 | 0.512975 | 9.70364e-05 | 19.0653 | 10440052 | 0.00948953 | 0.503582 | 19.0904 |