| Red | Green | Blue | |
| z | 17.64 | ||
| znorm | Inf | ||
| sky | -Inf | -Inf | -Inf |
| S/N | 33.7 | 52.0 | 53.2 |
| S/N(c) | 0.0 | 0.0 | 0.0 |
| SN(E/C) |
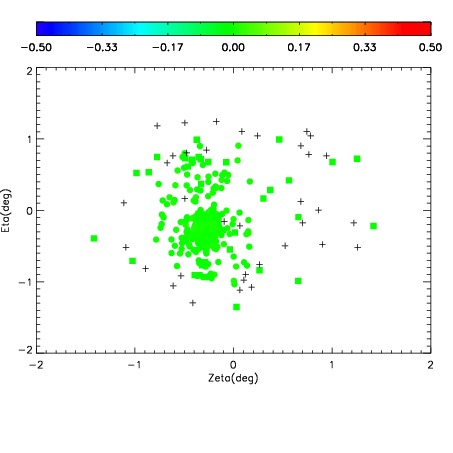
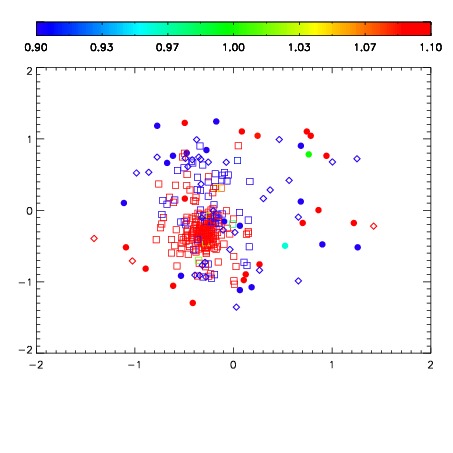
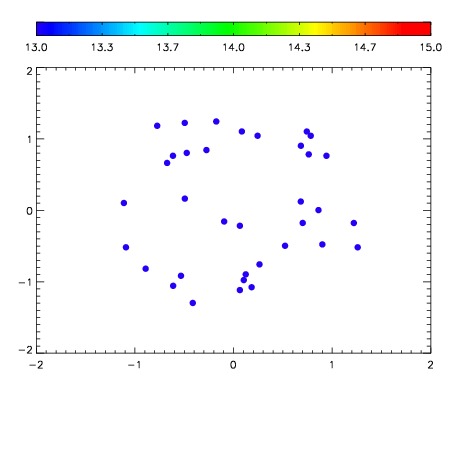

| Frame | Nreads | Zeropoints | Mag plots | Spatial mag deviation | Spatial sky 16325A emission deviations (filled: sky, open: star) | Spatial sky continuum emission | Spatial sky telluric CO2 absorption deviations (filled: H < 10) | |||||||||||||||||||||||
| 0 | 0 |
|
|
|
|
|
|
| IPAIR | NAME | SHIFT | NEWSHIFT | S/N | NAME | SHIFT | NEWSHIFT | S/N |
| 0 | 10450082 | 0.506447 | 0.00000 | 19.2537 | 10450083 | 0.00283668 | 0.503610 | 19.2574 |
| 1 | 10450081 | 0.505723 | 0.000724018 | 19.2649 | 10450080 | 0.00185489 | 0.504592 | 19.2597 |
| 2 | 10450077 | 0.501925 | 0.00452203 | 19.2448 | 10450079 | 0.00194693 | 0.504500 | 19.2421 |
| 3 | 10450078 | 0.502247 | 0.00420004 | 19.2189 | 10450076 | 0.00000 | 0.506447 | 19.2389 |