| Red | Green | Blue | |
| z | 17.63 | ||
| znorm | Inf | ||
| sky | -NaN | -NaN | -NaN |
| S/N | 21.8 | 36.7 | 35.6 |
| S/N(c) | 0.0 | 0.0 | 0.0 |
| SN(E/C) |
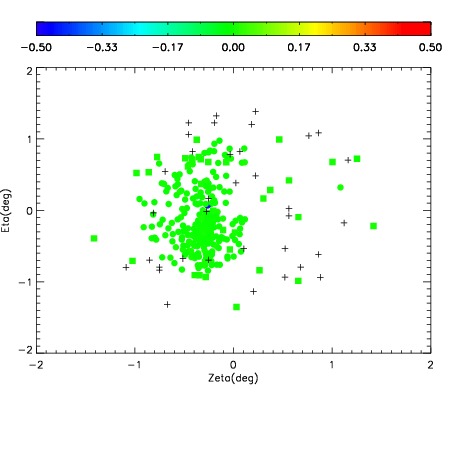
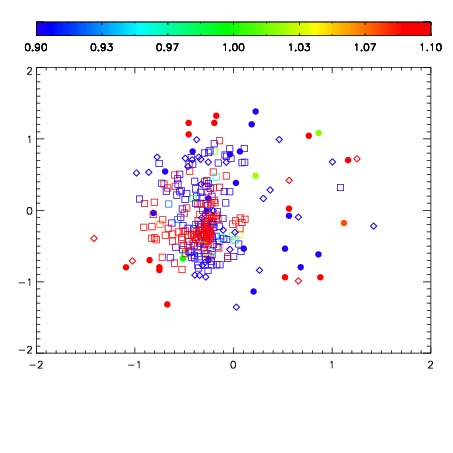


| Frame | Nreads | Zeropoints | Mag plots | Spatial mag deviation | Spatial sky 16325A emission deviations (filled: sky, open: star) | Spatial sky continuum emission | Spatial sky telluric CO2 absorption deviations (filled: H < 10) | |||||||||||||||||||||||
| 0 | 0 |
|
|
|
|
|
|
| IPAIR | NAME | SHIFT | NEWSHIFT | S/N | NAME | SHIFT | NEWSHIFT | S/N |
| 0 | 10660025 | 0.509325 | 0.00000 | 18.6533 | 10660028 | 0.00310453 | 0.506221 | 18.6363 |
| 1 | 10660026 | 0.509100 | 0.000225008 | 18.8139 | 10660027 | 0.00242246 | 0.506903 | 18.6865 |
| 2 | 10660029 | 0.508138 | 0.00118703 | 18.5635 | 10660024 | 0.00000 | 0.509325 | 18.5783 |
| 3 | 10660030 | 0.508830 | 0.000495017 | 18.4067 | 10660031 | 0.00612827 | 0.503197 | 18.4874 |