| Red | Green | Blue | |
| z | 17.64 | ||
| znorm | Inf | ||
| sky | -Inf | -Inf | -Inf |
| S/N | 25.6 | 42.9 | 43.6 |
| S/N(c) | 0.0 | 0.0 | 0.0 |
| SN(E/C) |

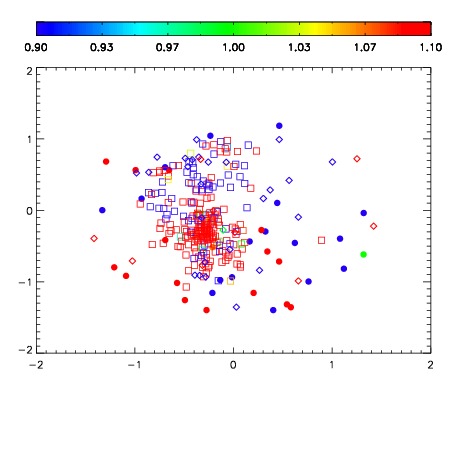
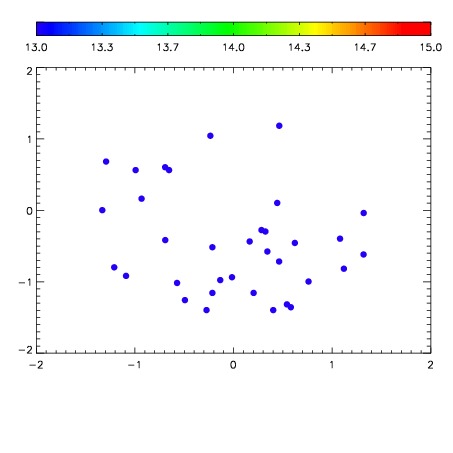

| Frame | Nreads | Zeropoints | Mag plots | Spatial mag deviation | Spatial sky 16325A emission deviations (filled: sky, open: star) | Spatial sky continuum emission | Spatial sky telluric CO2 absorption deviations (filled: H < 10) | |||||||||||||||||||||||
| 0 | 0 |
|
|
|
|
|
|
| IPAIR | NAME | SHIFT | NEWSHIFT | S/N | NAME | SHIFT | NEWSHIFT | S/N |
| 0 | 10740044 | 0.494396 | 0.00000 | 18.8471 | 10740045 | -0.000208518 | 0.494605 | 18.7583 |
| 1 | 10740048 | 0.493936 | 0.000459999 | 19.0238 | 10740049 | -0.000882554 | 0.495279 | 19.0336 |
| 2 | 10740047 | 0.493042 | 0.00135401 | 19.0200 | 10740046 | -0.000601653 | 0.494998 | 18.8670 |
| 3 | 10740043 | 0.494242 | 0.000153989 | 18.8710 | 10740042 | 0.00000 | 0.494396 | 18.8536 |