| Red | Green | Blue | |
| z | 17.65 | ||
| znorm | Inf | ||
| sky | -Inf | -Inf | -Inf |
| S/N | 4.3 | 8.8 | 8.3 |
| S/N(c) | 0.0 | 0.0 | 0.0 |
| SN(E/C) |
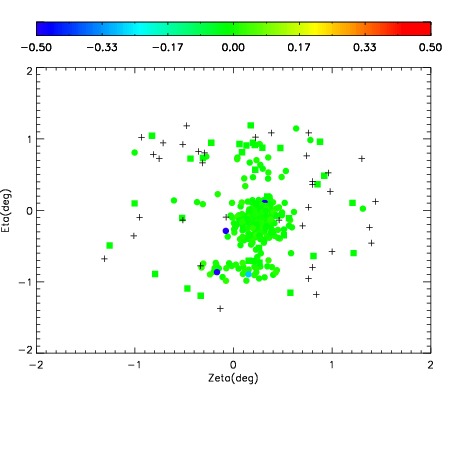
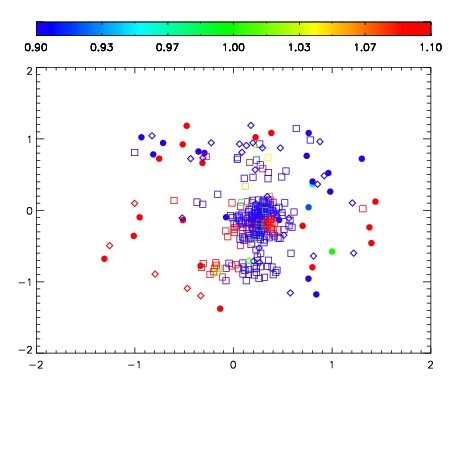
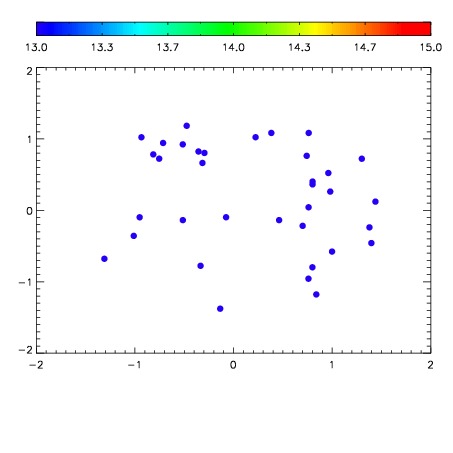

| Frame | Nreads | Zeropoints | Mag plots | Spatial mag deviation | Spatial sky 16325A emission deviations (filled: sky, open: star) | Spatial sky continuum emission | Spatial sky telluric CO2 absorption deviations (filled: H < 10) | |||||||||||||||||||||||
| 0 | 0 |
|
|
|
|
|
|
| IPAIR | NAME | SHIFT | NEWSHIFT | S/N | NAME | SHIFT | NEWSHIFT | S/N |
| 0 | 10930030 | 0.514902 | 0.00000 | 13.7615 | 10930031 | -0.00101811 | 0.515920 | 12.9407 |
| 1 | 10930025 | 0.512652 | 0.00225002 | 17.2028 | 10930024 | 0.00000 | 0.514902 | 17.5143 |
| 2 | 10930026 | 0.512809 | 0.00209302 | 16.1227 | 10930027 | -0.00293414 | 0.517836 | 15.7225 |
| 3 | 10930029 | 0.514744 | 0.000158012 | 14.7017 | 10930028 | -0.00208534 | 0.516987 | 14.3637 |