| Red | Green | Blue | |
| z | 17.64 | ||
| znorm | Inf | ||
| sky | -Inf | -Inf | -Inf |
| S/N | 30.3 | 47.9 | 48.6 |
| S/N(c) | 0.0 | 0.0 | 0.0 |
| SN(E/C) |


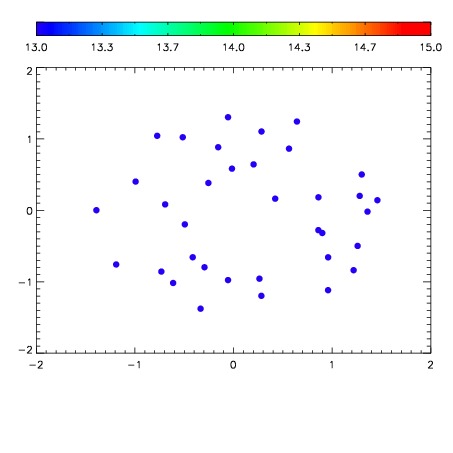

| Frame | Nreads | Zeropoints | Mag plots | Spatial mag deviation | Spatial sky 16325A emission deviations (filled: sky, open: star) | Spatial sky continuum emission | Spatial sky telluric CO2 absorption deviations (filled: H < 10) | |||||||||||||||||||||||
| 0 | 0 |
|
|
|
|
|
|
| IPAIR | NAME | SHIFT | NEWSHIFT | S/N | NAME | SHIFT | NEWSHIFT | S/N |
| 0 | 11040040 | 0.479787 | 0.00000 | 19.0966 | 11040041 | -0.00368433 | 0.483471 | 19.0933 |
| 1 | 11040044 | 0.479184 | 0.000602990 | 19.1231 | 11040045 | -0.00221447 | 0.482001 | 19.1576 |
| 2 | 11040039 | 0.479029 | 0.000757992 | 19.1002 | 11040042 | -0.00421162 | 0.483999 | 19.1058 |
| 3 | 11040043 | 0.477961 | 0.00182599 | 19.0889 | 11040038 | 0.00000 | 0.479787 | 19.0766 |