| Red | Green | Blue | |
| z | 17.64 | ||
| znorm | Inf | ||
| sky | -Inf | -Inf | -Inf |
| S/N | 21.8 | 36.8 | 37.5 |
| S/N(c) | 0.0 | 0.0 | 0.0 |
| SN(E/C) |
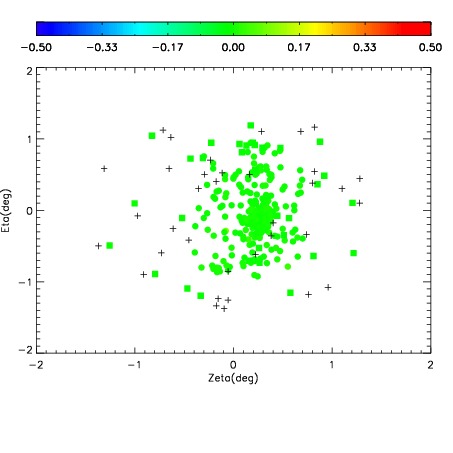
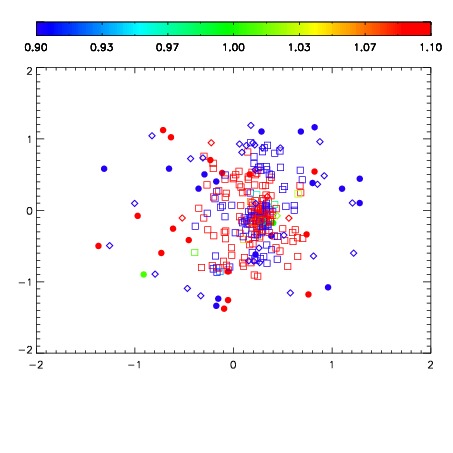
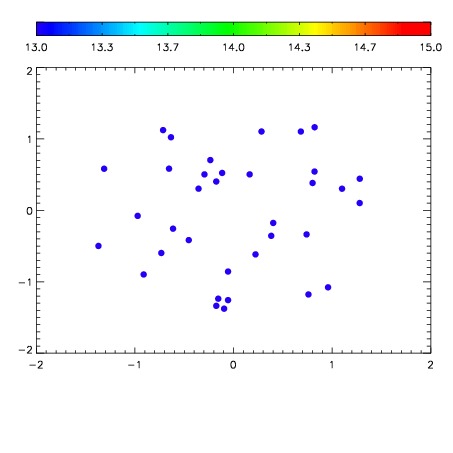

| Frame | Nreads | Zeropoints | Mag plots | Spatial mag deviation | Spatial sky 16325A emission deviations (filled: sky, open: star) | Spatial sky continuum emission | Spatial sky telluric CO2 absorption deviations (filled: H < 10) | |||||||||||||||||||||||
| 0 | 0 |
|
|
|
|
|
|
| IPAIR | NAME | SHIFT | NEWSHIFT | S/N | NAME | SHIFT | NEWSHIFT | S/N |
| 0 | 11080043 | 0.477626 | 0.00000 | 18.8400 | 11080044 | -0.000411120 | 0.478037 | 18.9556 |
| 1 | 11080042 | 0.477012 | 0.000613987 | 18.7980 | 11080041 | -0.00114143 | 0.478767 | 18.8595 |
| 2 | 11080039 | 0.477110 | 0.000515997 | 18.6292 | 11080040 | -0.000968675 | 0.478595 | 18.7419 |
| 3 | 11080038 | 0.476386 | 0.00123999 | 18.5039 | 11080037 | 0.00000 | 0.477626 | 18.2470 |