| Red | Green | Blue | |
| z | 17.64 | ||
| znorm | Inf | ||
| sky | -NaN | -Inf | -Inf |
| S/N | 28.5 | 45.8 | 46.4 |
| S/N(c) | 0.0 | 0.0 | 0.0 |
| SN(E/C) |
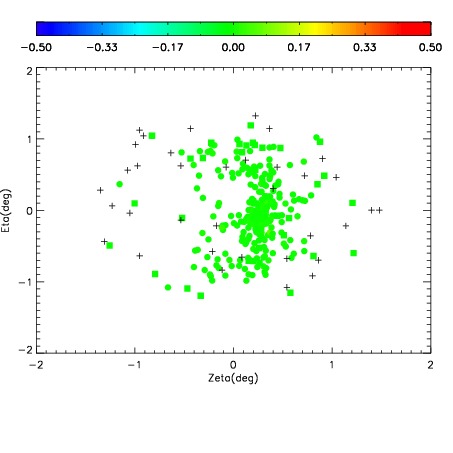
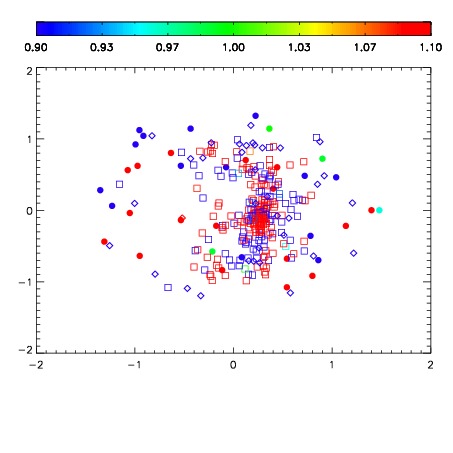
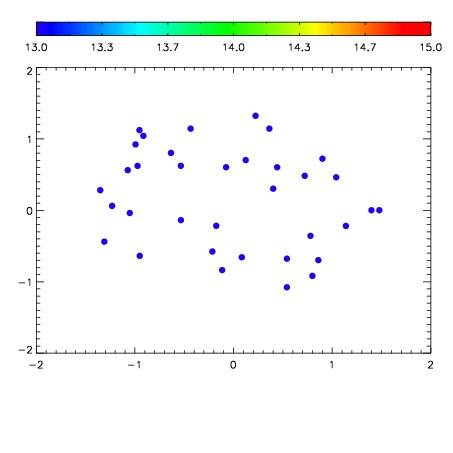

| Frame | Nreads | Zeropoints | Mag plots | Spatial mag deviation | Spatial sky 16325A emission deviations (filled: sky, open: star) | Spatial sky continuum emission | Spatial sky telluric CO2 absorption deviations (filled: H < 10) | |||||||||||||||||||||||
| 0 | 0 |
|
|
|
|
|
|
| IPAIR | NAME | SHIFT | NEWSHIFT | S/N | NAME | SHIFT | NEWSHIFT | S/N |
| 0 | 11090040 | 0.482547 | 0.00000 | 19.0640 | 11090042 | -0.000338202 | 0.482885 | 19.0526 |
| 1 | 11090043 | 0.480584 | 0.00196299 | 19.0894 | 11090045 | 0.000683565 | 0.481863 | 19.1068 |
| 2 | 11090044 | 0.481363 | 0.00118399 | 19.0715 | 11090041 | -0.000408667 | 0.482956 | 19.0586 |
| 3 | 11090039 | 0.481224 | 0.00132298 | 19.0321 | 11090038 | 0.00000 | 0.482547 | 19.0259 |