| Red | Green | Blue | |
| z | 17.64 | ||
| znorm | Inf | ||
| sky | -Inf | -Inf | -NaN |
| S/N | 23.8 | 39.7 | 38.3 |
| S/N(c) | 0.0 | 0.0 | 0.0 |
| SN(E/C) |
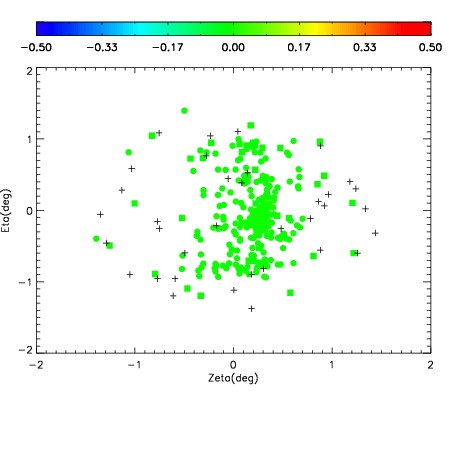
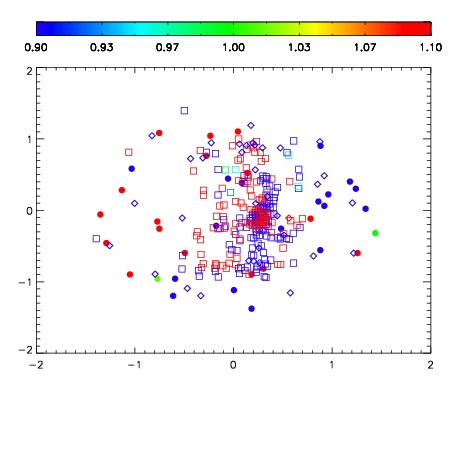
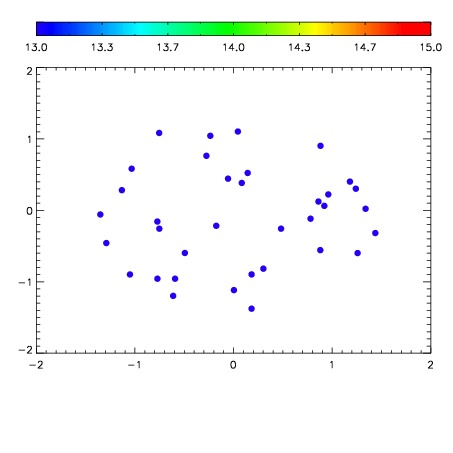

| Frame | Nreads | Zeropoints | Mag plots | Spatial mag deviation | Spatial sky 16325A emission deviations (filled: sky, open: star) | Spatial sky continuum emission | Spatial sky telluric CO2 absorption deviations (filled: H < 10) | |||||||||||||||||||||||
| 0 | 0 |
|
|
|
|
|
|
| IPAIR | NAME | SHIFT | NEWSHIFT | S/N | NAME | SHIFT | NEWSHIFT | S/N |
| 0 | 11100039 | 0.471724 | 0.00000 | 18.7257 | 11100037 | 0.00000 | 0.471724 | 18.6512 |
| 1 | 11100043 | 0.470362 | 0.00136200 | 18.8527 | 11100044 | -0.00455560 | 0.476280 | 18.9234 |
| 2 | 11100042 | 0.469371 | 0.00235301 | 18.8188 | 11100041 | -0.000457972 | 0.472182 | 18.7623 |
| 3 | 11100038 | 0.470756 | 0.000968009 | 18.7212 | 11100040 | 7.34632e-05 | 0.471651 | 18.5051 |