| Red | Green | Blue | |
| z | 17.64 | ||
| znorm | Inf | ||
| sky | -Inf | -Inf | -Inf |
| S/N | 20.7 | 34.7 | 34.1 |
| S/N(c) | 0.0 | 0.0 | 0.0 |
| SN(E/C) |
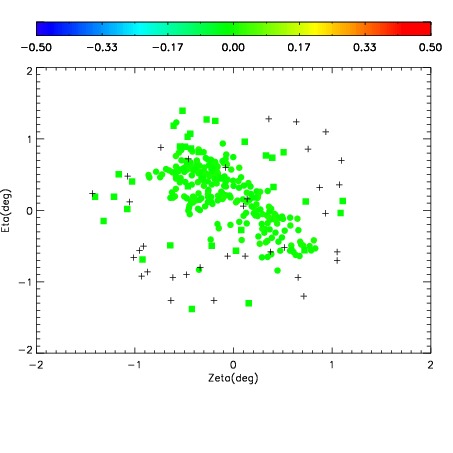
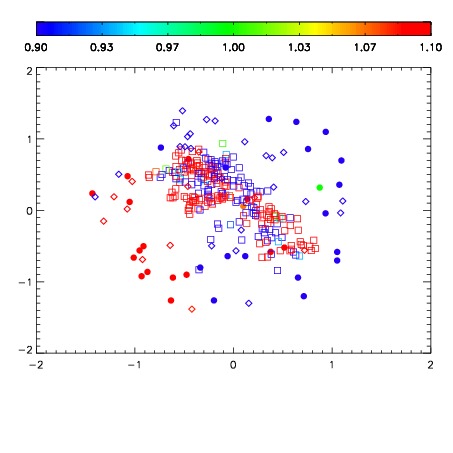
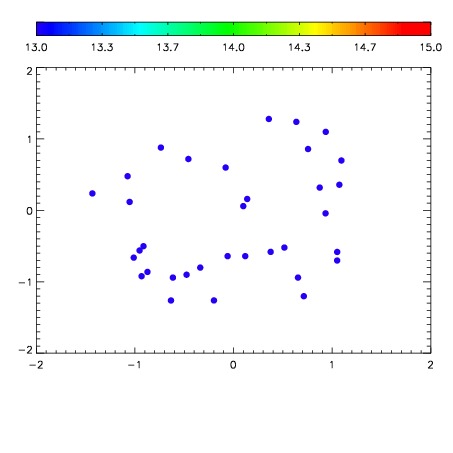

| Frame | Nreads | Zeropoints | Mag plots | Spatial mag deviation | Spatial sky 16325A emission deviations (filled: sky, open: star) | Spatial sky continuum emission | Spatial sky telluric CO2 absorption deviations (filled: H < 10) | |||||||||||||||||||||||
| 0 | 0 |
|
|
|
|
|
|
| IPAIR | NAME | SHIFT | NEWSHIFT | S/N | NAME | SHIFT | NEWSHIFT | S/N |
| 0 | 10900017 | 0.747044 | 0.00000 | 18.5958 | 10900018 | 0.253716 | 0.493328 | 18.6064 |
| 1 | 10900013 | 0.507731 | 0.239313 | 18.5891 | 10900011 | 0.00000 | 0.747044 | 18.5662 |
| 2 | 10900012 | 0.507366 | 0.239678 | 18.5861 | 10900014 | 0.233020 | 0.514024 | 18.5292 |
| 3 | 10900016 | 0.745832 | 0.00121200 | 18.5087 | 10900015 | 0.233609 | 0.513435 | 18.4118 |