| Red | Green | Blue | |
| z | 17.64 | ||
| znorm | Inf | ||
| sky | -Inf | -Inf | -NaN |
| S/N | 23.1 | 38.9 | 36.8 |
| S/N(c) | 0.0 | 0.0 | 0.0 |
| SN(E/C) |
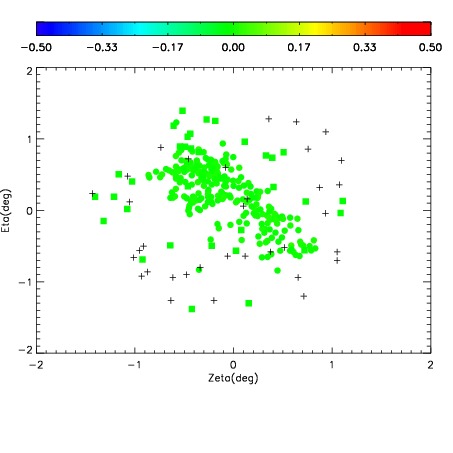
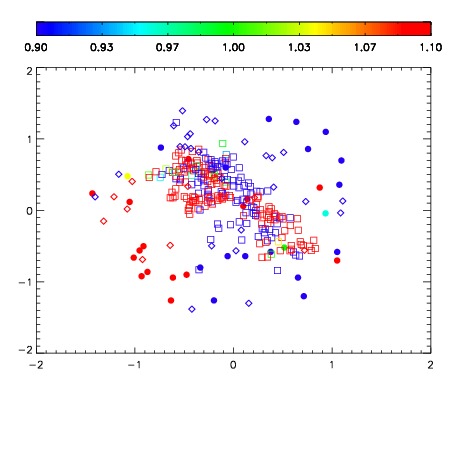
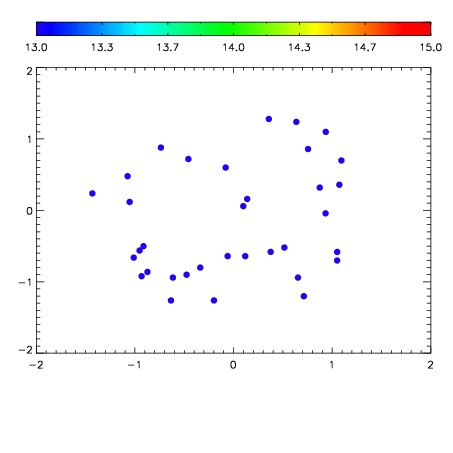

| Frame | Nreads | Zeropoints | Mag plots | Spatial mag deviation | Spatial sky 16325A emission deviations (filled: sky, open: star) | Spatial sky continuum emission | Spatial sky telluric CO2 absorption deviations (filled: H < 10) | |||||||||||||||||||||||
| 0 | 0 |
|
|
|
|
|
|
| IPAIR | NAME | SHIFT | NEWSHIFT | S/N | NAME | SHIFT | NEWSHIFT | S/N |
| 0 | 10910037 | 0.511378 | 0.00000 | 18.7349 | 10910039 | -0.00181485 | 0.513193 | 18.7238 |
| 1 | 10910036 | 0.510882 | 0.000495970 | 18.8104 | 10910035 | 0.00000 | 0.511378 | 18.8385 |
| 2 | 10910041 | 0.510479 | 0.000899017 | 18.7101 | 10910042 | -0.000265052 | 0.511643 | 18.6984 |
| 3 | 10910040 | 0.509864 | 0.00151402 | 18.5636 | 10910038 | -0.00175470 | 0.513133 | 18.6980 |