| Red | Green | Blue | |
| z | 17.64 | ||
| znorm | Inf | ||
| sky | -Inf | -Inf | -Inf |
| S/N | 32.6 | 53.8 | 53.2 |
| S/N(c) | 0.0 | 0.0 | 0.0 |
| SN(E/C) |
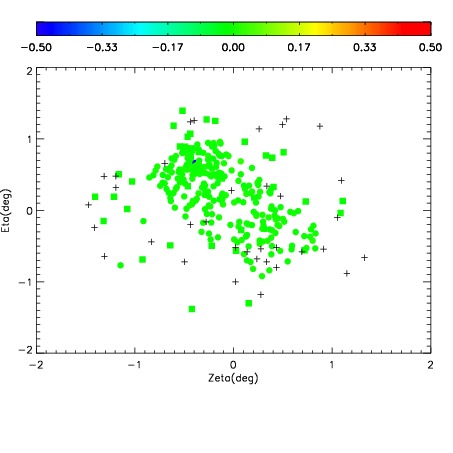
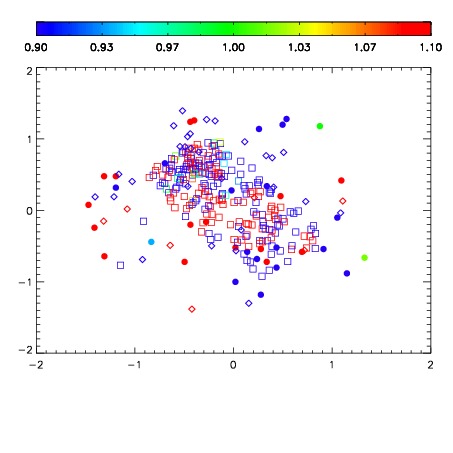
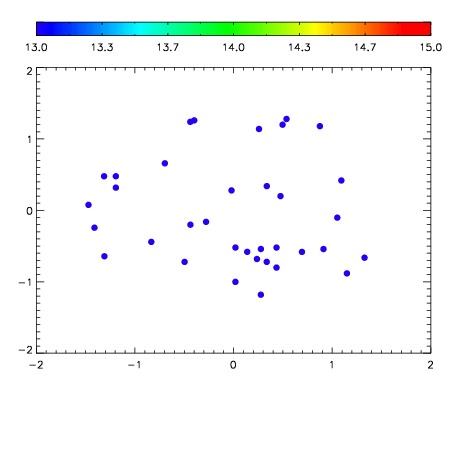

| Frame | Nreads | Zeropoints | Mag plots | Spatial mag deviation | Spatial sky 16325A emission deviations (filled: sky, open: star) | Spatial sky continuum emission | Spatial sky telluric CO2 absorption deviations (filled: H < 10) | |||||||||||||||||||||||
| 0 | 0 |
|
|
|
|
|
|
| IPAIR | NAME | SHIFT | NEWSHIFT | S/N | NAME | SHIFT | NEWSHIFT | S/N |
| 0 | 10920033 | 0.517194 | 0.00000 | 19.0529 | 10920031 | -0.00248824 | 0.519682 | 19.0512 |
| 1 | 10920030 | 0.514419 | 0.00277495 | 19.0746 | 10920028 | -0.00302987 | 0.520224 | 19.1061 |
| 2 | 10920029 | 0.513702 | 0.00349200 | 19.0585 | 10920027 | -0.00311256 | 0.520307 | 19.0631 |
| 3 | 10920026 | 0.515768 | 0.00142598 | 19.0246 | 10920032 | -0.00166394 | 0.518858 | 18.9345 |
| 4 | 10920025 | 0.516362 | 0.000831962 | 19.0050 | 10920024 | 0.00000 | 0.517194 | 18.9067 |