| Red | Green | Blue | |
| z | 17.64 | ||
| znorm | Inf | ||
| sky | -Inf | -Inf | -Inf |
| S/N | 27.4 | 44.8 | 45.5 |
| S/N(c) | 0.0 | 0.0 | 0.0 |
| SN(E/C) |
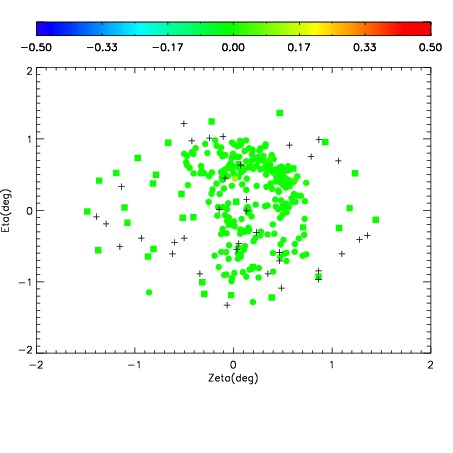
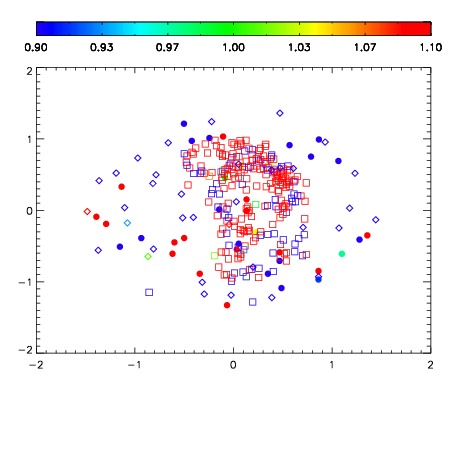
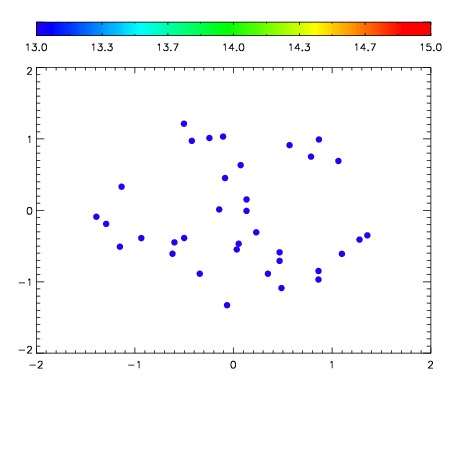

| Frame | Nreads | Zeropoints | Mag plots | Spatial mag deviation | Spatial sky 16325A emission deviations (filled: sky, open: star) | Spatial sky continuum emission | Spatial sky telluric CO2 absorption deviations (filled: H < 10) | |||||||||||||||||||||||
| 0 | 0 |
|
|
|
|
|
|
| IPAIR | NAME | SHIFT | NEWSHIFT | S/N | NAME | SHIFT | NEWSHIFT | S/N |
| 0 | 10250089 | 0.494217 | 0.00000 | 19.0827 | 10250090 | 0.00171263 | 0.492504 | 19.0888 |
| 1 | 10250088 | 0.493688 | 0.000529021 | 19.0098 | 10250083 | 0.00000 | 0.494217 | 19.0178 |
| 2 | 10250084 | 0.491963 | 0.00225401 | 18.9932 | 10250086 | 0.00182633 | 0.492391 | 18.9695 |
| 3 | 10250085 | 0.492234 | 0.00198302 | 18.9253 | 10250087 | 0.00192877 | 0.492288 | 18.9235 |