| Red | Green | Blue | |
| z | 17.64 | ||
| znorm | Inf | ||
| sky | -Inf | -Inf | -Inf |
| S/N | 23.7 | 39.6 | 41.9 |
| S/N(c) | 0.0 | 0.0 | 0.0 |
| SN(E/C) |
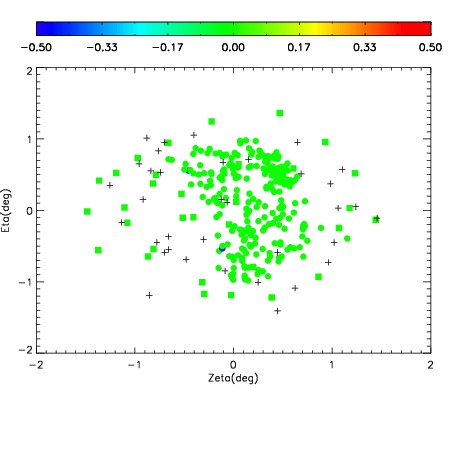
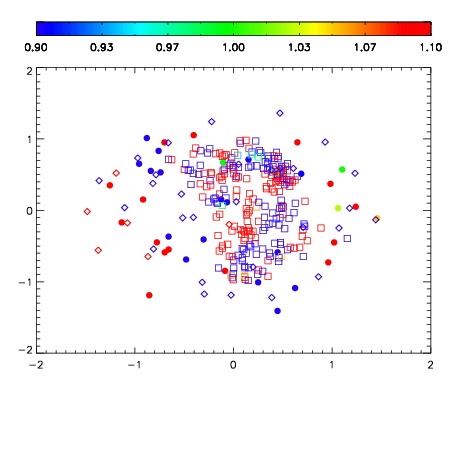
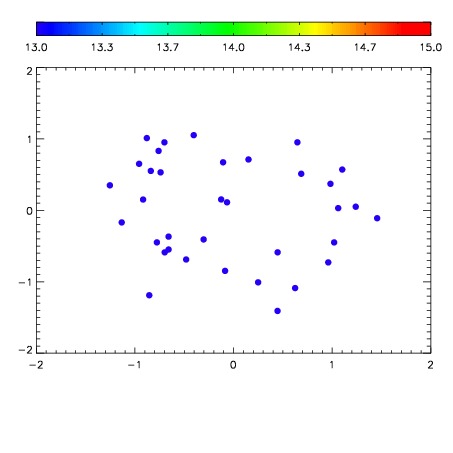

| Frame | Nreads | Zeropoints | Mag plots | Spatial mag deviation | Spatial sky 16325A emission deviations (filled: sky, open: star) | Spatial sky continuum emission | Spatial sky telluric CO2 absorption deviations (filled: H < 10) | |||||||||||||||||||||||
| 0 | 0 |
|
|
|
|
|
|
| IPAIR | NAME | SHIFT | NEWSHIFT | S/N | NAME | SHIFT | NEWSHIFT | S/N |
| 0 | 11120038 | 0.483926 | 0.00000 | 18.7891 | 11120037 | 0.00000 | 0.483926 | 18.7493 |
| 1 | 11120043 | 0.482974 | 0.000952005 | 18.9065 | 11120044 | -0.00311116 | 0.487037 | 18.9904 |
| 2 | 11120042 | 0.482646 | 0.00128001 | 18.8921 | 11120041 | -0.00375300 | 0.487679 | 18.8745 |
| 3 | 11120039 | 0.483662 | 0.000263989 | 18.5654 | 11120040 | -0.00361839 | 0.487544 | 18.6326 |