| Red | Green | Blue | |
| z | 17.64 | ||
| znorm | Inf | ||
| sky | -Inf | -Inf | -Inf |
| S/N | 26.9 | 46.4 | 49.5 |
| S/N(c) | 0.0 | 0.0 | 0.0 |
| SN(E/C) |
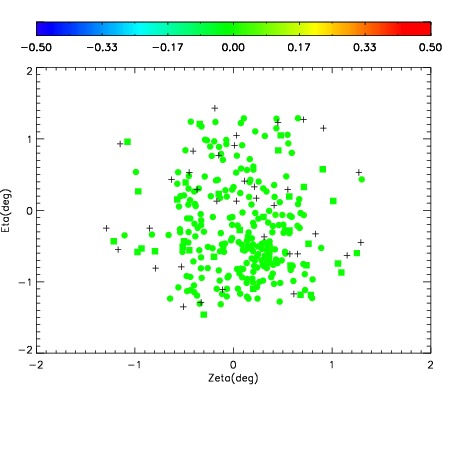
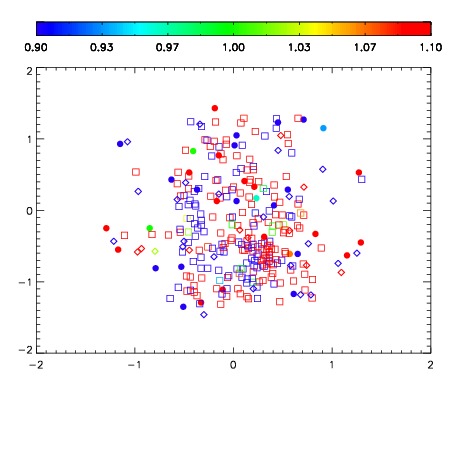
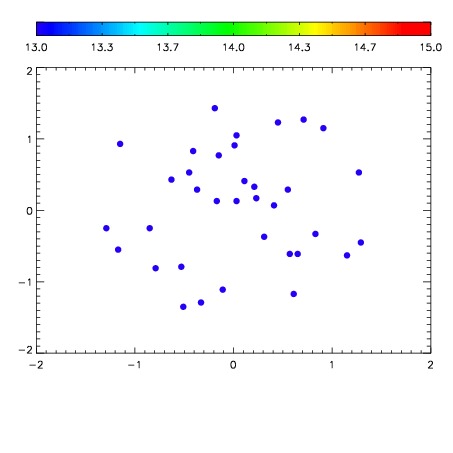

| Frame | Nreads | Zeropoints | Mag plots | Spatial mag deviation | Spatial sky 16325A emission deviations (filled: sky, open: star) | Spatial sky continuum emission | Spatial sky telluric CO2 absorption deviations (filled: H < 10) | |||||||||||||||||||||||
| 0 | 0 |
|
|
|
|
|
|
| IPAIR | NAME | SHIFT | NEWSHIFT | S/N | NAME | SHIFT | NEWSHIFT | S/N |
| 0 | 11070043 | 0.482718 | 0.00000 | 19.1196 | 11070037 | 0.00000 | 0.482718 | 19.0210 |
| 1 | 11070042 | 0.481635 | 0.00108299 | 19.1320 | 11070044 | -0.00140252 | 0.484121 | 19.1599 |
| 2 | 11070039 | 0.481188 | 0.00152999 | 19.0876 | 11070040 | -0.00190364 | 0.484622 | 18.9706 |
| 3 | 11070038 | 0.480276 | 0.00244200 | 18.9665 | 11070041 | -0.000469269 | 0.483187 | 18.8474 |