| Red | Green | Blue | |
| z | 17.64 | ||
| znorm | Inf | ||
| sky | -Inf | -Inf | -NaN |
| S/N | 20.0 | 36.0 | 38.2 |
| S/N(c) | 0.0 | 0.0 | 0.0 |
| SN(E/C) |
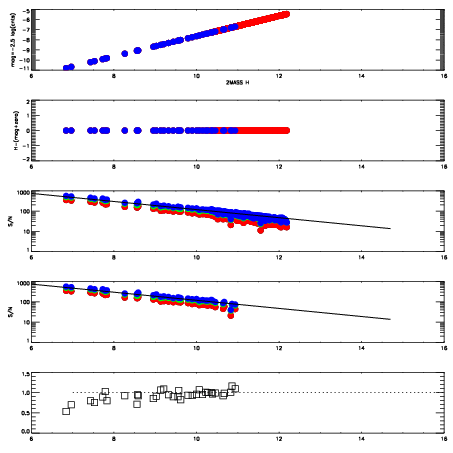
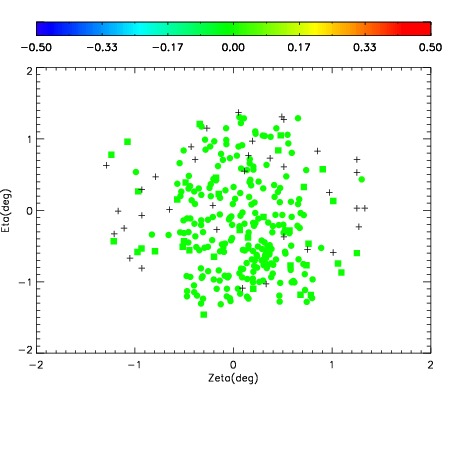
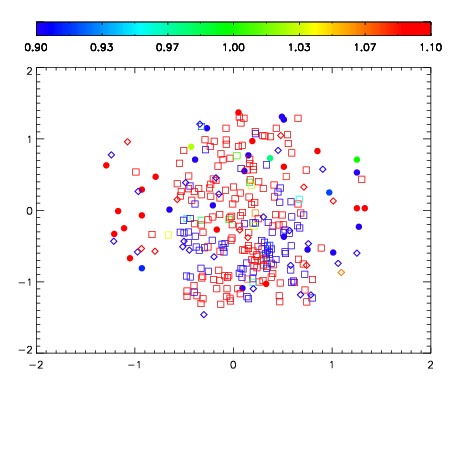
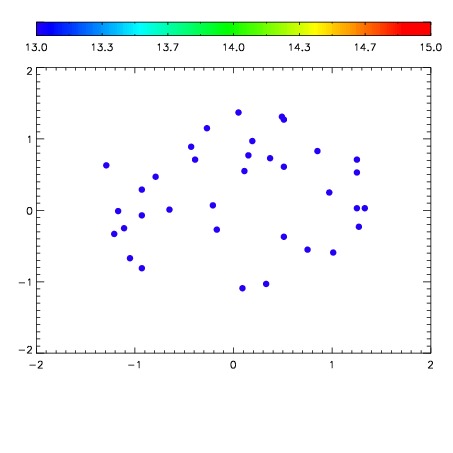

| Frame | Nreads | Zeropoints | Mag plots | Spatial mag deviation | Spatial sky 16325A emission deviations (filled: sky, open: star) | Spatial sky continuum emission | Spatial sky telluric CO2 absorption deviations (filled: H < 10) | |||||||||||||||||||||||
| 0 | 0 |
|
|
|
|
|
|
| IPAIR | NAME | SHIFT | NEWSHIFT | S/N | NAME | SHIFT | NEWSHIFT | S/N |
| 0 | 10900028 | 0.604005 | 0.00000 | 18.5264 | 10900022 | 0.00000 | 0.604005 | 18.6683 |
| 1 | 10900024 | 0.527369 | 0.0766360 | 18.6844 | 10900026 | 0.0834835 | 0.520521 | 18.7215 |
| 2 | 10900023 | 0.527122 | 0.0768830 | 18.6710 | 10900025 | 0.0826794 | 0.521326 | 18.6877 |
| 3 | 10900027 | 0.603843 | 0.000162005 | 18.4155 | 10900029 | 0.0831683 | 0.520837 | 18.6074 |