| Red | Green | Blue | |
| z | 17.64 | ||
| znorm | Inf | ||
| sky | -Inf | -Inf | -NaN |
| S/N | 29.1 | 46.9 | 51.4 |
| S/N(c) | 0.0 | 0.0 | 0.0 |
| SN(E/C) |
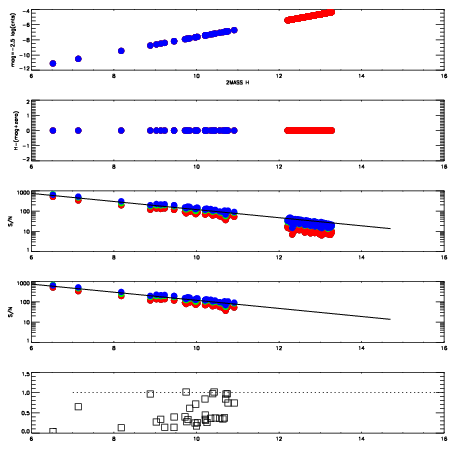
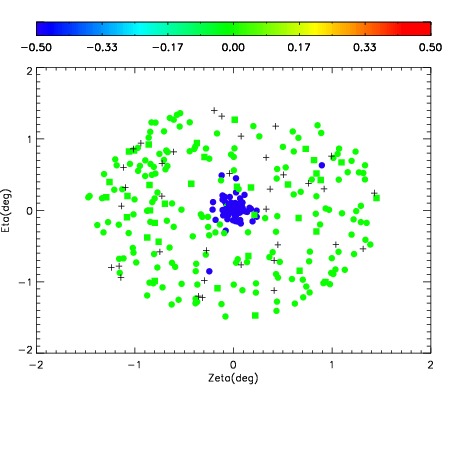
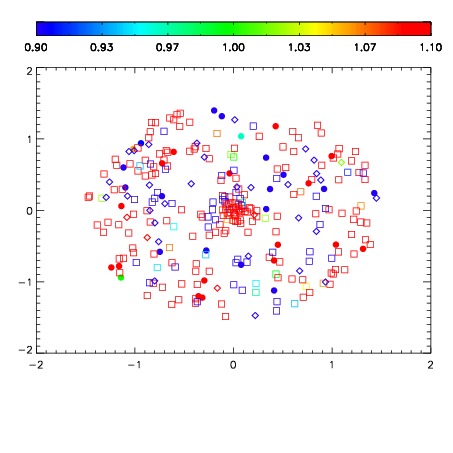
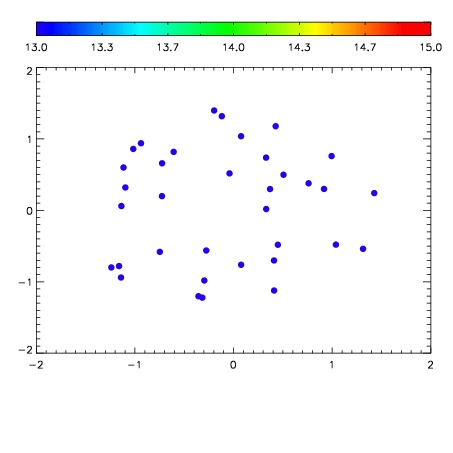

| Frame | Nreads | Zeropoints | Mag plots | Spatial mag deviation | Spatial sky 16325A emission deviations (filled: sky, open: star) | Spatial sky continuum emission | Spatial sky telluric CO2 absorption deviations (filled: H < 10) | |||||||||||||||||||||||
| 0 | 0 |
|
|
|
|
|
|
| IPAIR | NAME | SHIFT | NEWSHIFT | S/N | NAME | SHIFT | NEWSHIFT | S/N |
| 0 | 11100076 | 0.474529 | 0.00000 | 18.7970 | 11100073 | -0.00512110 | 0.479650 | 18.8777 |
| 1 | 11100072 | 0.472741 | 0.00178799 | 18.8353 | 11100074 | -0.00493764 | 0.479467 | 18.8835 |
| 2 | 11100075 | 0.473712 | 0.000817001 | 18.6844 | 11100077 | -0.00456391 | 0.479093 | 18.8331 |
| 3 | 11100071 | 0.473001 | 0.00152799 | 18.4102 | 11100070 | 0.00000 | 0.474529 | 18.5019 |