| Red | Green | Blue | |
| z | 17.63 | ||
| znorm | Inf | ||
| sky | -Inf | -NaN | -NaN |
| S/N | 35.5 | 56.3 | 61.5 |
| S/N(c) | 0.0 | 0.0 | 0.0 |
| SN(E/C) |
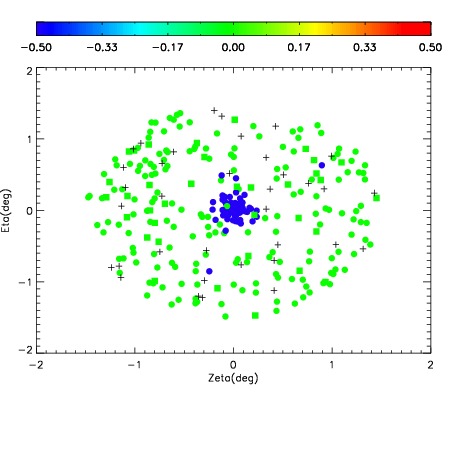
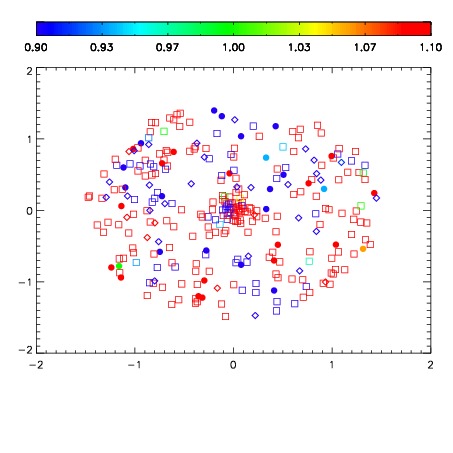
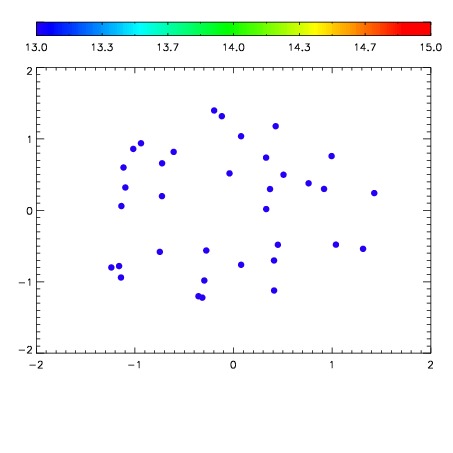

| Frame | Nreads | Zeropoints | Mag plots | Spatial mag deviation | Spatial sky 16325A emission deviations (filled: sky, open: star) | Spatial sky continuum emission | Spatial sky telluric CO2 absorption deviations (filled: H < 10) | |||||||||||||||||||||||
| 0 | 0 |
|
|
|
|
|
|
| IPAIR | NAME | SHIFT | NEWSHIFT | S/N | NAME | SHIFT | NEWSHIFT | S/N |
| 0 | 11150054 | 0.482790 | 0.00000 | 19.0246 | 11150051 | -0.000282150 | 0.483072 | 18.9972 |
| 1 | 11150053 | 0.481905 | 0.000884980 | 18.9629 | 11150052 | 3.93484e-05 | 0.482751 | 18.9854 |
| 2 | 11150050 | 0.481673 | 0.00111699 | 18.8852 | 11150055 | 0.00151296 | 0.481277 | 18.9254 |
| 3 | 11150049 | 0.480507 | 0.00228301 | 18.7370 | 11150056 | 0.00122039 | 0.481570 | 18.8827 |
| 4 | 11150057 | 0.482711 | 7.90060e-05 | 18.6028 | 11150048 | 0.00000 | 0.482790 | 18.7830 |