| Red | Green | Blue | |
| z | 17.64 | ||
| znorm | Inf | ||
| sky | -Inf | -Inf | -Inf |
| S/N | 32.3 | 51.2 | 57.1 |
| S/N(c) | 0.0 | 0.0 | 0.0 |
| SN(E/C) |
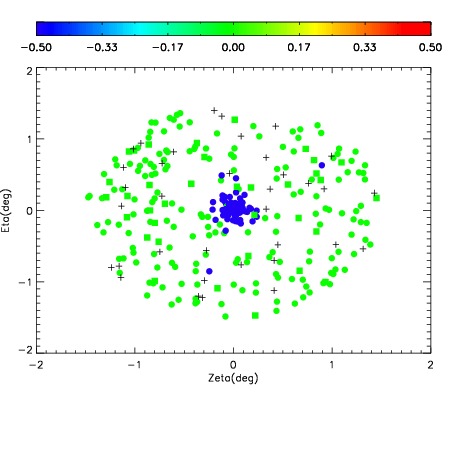
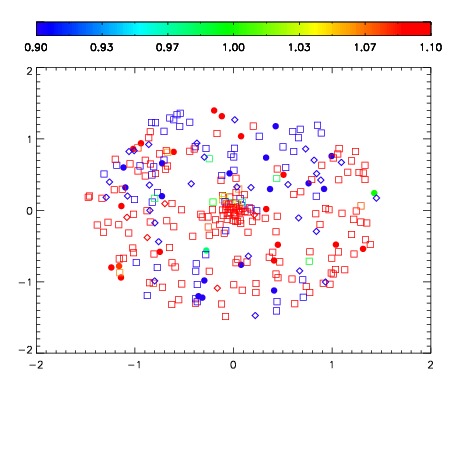
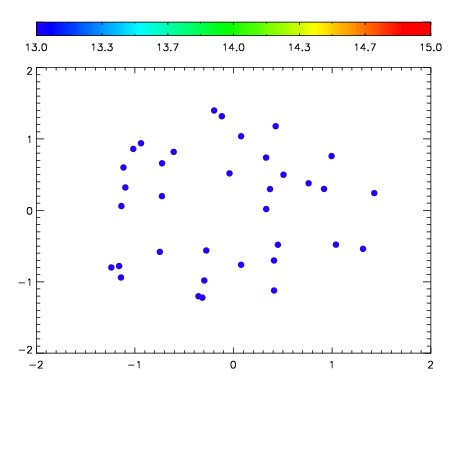

| Frame | Nreads | Zeropoints | Mag plots | Spatial mag deviation | Spatial sky 16325A emission deviations (filled: sky, open: star) | Spatial sky continuum emission | Spatial sky telluric CO2 absorption deviations (filled: H < 10) | |||||||||||||||||||||||
| 0 | 0 |
|
|
|
|
|
|
| IPAIR | NAME | SHIFT | NEWSHIFT | S/N | NAME | SHIFT | NEWSHIFT | S/N |
| 0 | 11380054 | 0.477211 | 0.00000 | 19.0352 | 11380052 | -3.46182e-05 | 0.477246 | 19.0193 |
| 1 | 11380053 | 0.476117 | 0.00109398 | 18.9895 | 11380055 | 0.000959758 | 0.476251 | 18.9970 |
| 2 | 11380050 | 0.476481 | 0.000730008 | 18.9164 | 11380051 | 9.68091e-05 | 0.477114 | 18.9940 |
| 3 | 11380049 | 0.475232 | 0.00197899 | 18.2345 | 11380048 | 0.00000 | 0.477211 | 18.7714 |