| Red | Green | Blue | |
| z | 17.64 | ||
| znorm | Inf | ||
| sky | -Inf | -Inf | -NaN |
| S/N | 27.2 | 44.6 | 50.2 |
| S/N(c) | 0.0 | 0.0 | 0.0 |
| SN(E/C) |
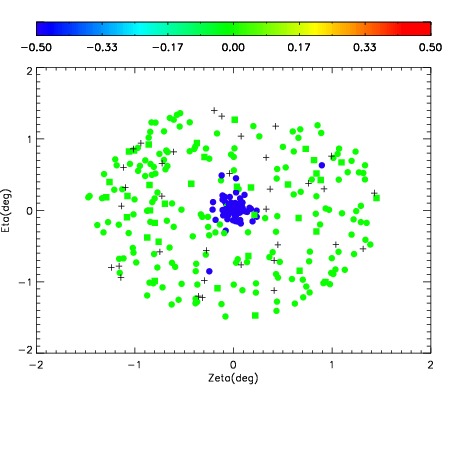
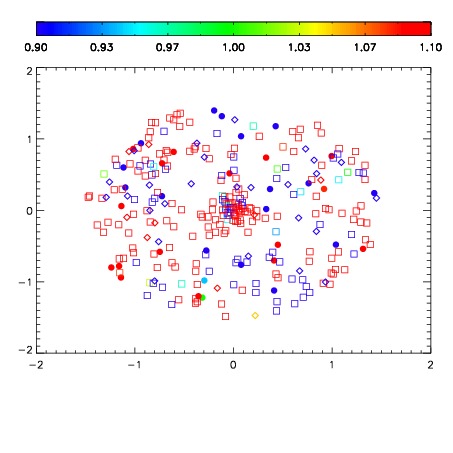
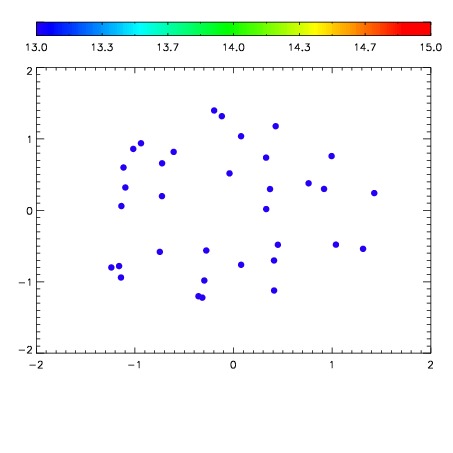

| Frame | Nreads | Zeropoints | Mag plots | Spatial mag deviation | Spatial sky 16325A emission deviations (filled: sky, open: star) | Spatial sky continuum emission | Spatial sky telluric CO2 absorption deviations (filled: H < 10) | |||||||||||||||||||||||
| 0 | 0 |
|
|
|
|
|
|
| IPAIR | NAME | SHIFT | NEWSHIFT | S/N | NAME | SHIFT | NEWSHIFT | S/N |
| 0 | 11720027 | 0.494759 | 0.00000 | 18.7277 | 11720029 | 0.000560883 | 0.494198 | 18.6791 |
| 1 | 11720028 | 0.494565 | 0.000193983 | 18.7718 | 11720026 | 0.00000 | 0.494759 | 18.7468 |
| 2 | 11720031 | 0.493850 | 0.000909001 | 18.5746 | 11720030 | 0.000402087 | 0.494357 | 18.5811 |
| 3 | 11720032 | 0.493178 | 0.00158098 | 18.5405 | 11720033 | -0.00131707 | 0.496076 | 18.4822 |