| Red | Green | Blue | |
| z | 17.64 | ||
| znorm | Inf | ||
| sky | -Inf | -Inf | -Inf |
| S/N | 46.4 | 73.7 | 82.6 |
| S/N(c) | 0.0 | 0.0 | 0.0 |
| SN(E/C) |
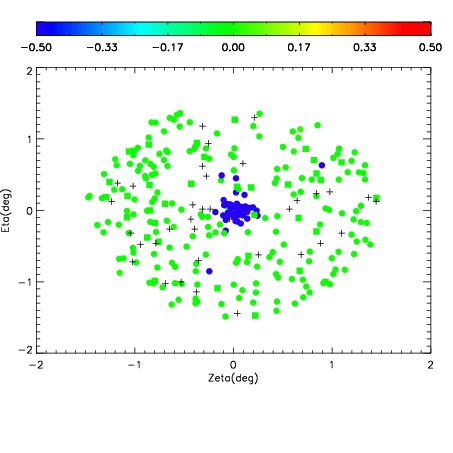
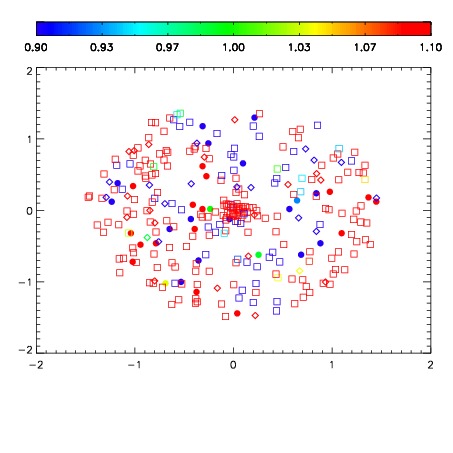
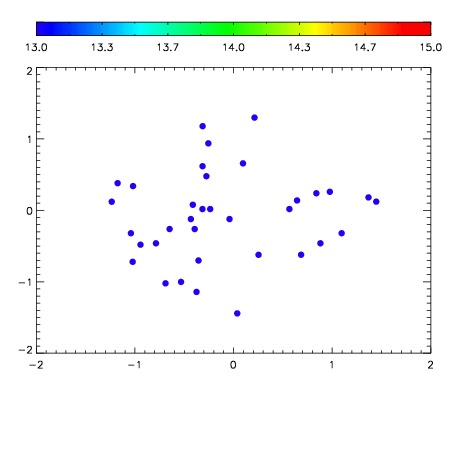

| Frame | Nreads | Zeropoints | Mag plots | Spatial mag deviation | Spatial sky 16325A emission deviations (filled: sky, open: star) | Spatial sky continuum emission | Spatial sky telluric CO2 absorption deviations (filled: H < 10) | |||||||||||||||||||||||
| 0 | 0 |
|
|
|
|
|
|
| IPAIR | NAME | SHIFT | NEWSHIFT | S/N | NAME | SHIFT | NEWSHIFT | S/N |
| 0 | 10880105 | 0.506008 | 0.00000 | 18.8832 | 10880095 | -0.00122443 | 0.507232 | 18.9248 |
| 1 | 10880093 | 0.502494 | 0.00351405 | 19.0635 | 10880094 | -0.00233182 | 0.508340 | 19.0456 |
| 2 | 10880092 | 0.501273 | 0.00473505 | 18.9942 | 10880103 | 0.000645189 | 0.505363 | 19.0245 |
| 3 | 10880104 | 0.505266 | 0.000742018 | 18.8834 | 10880091 | 0.00000 | 0.506008 | 18.9862 |
| 4 | 10880100 | 0.504235 | 0.00177300 | 18.8565 | 10880102 | 0.000246375 | 0.505762 | 18.8493 |
| 5 | 10880101 | 0.504799 | 0.00120902 | 18.8265 | 10880106 | 0.000690705 | 0.505317 | 18.8071 |
| 6 | 10880096 | 0.501440 | 0.00456804 | 18.7339 | 10880099 | -0.000532078 | 0.506540 | 18.7079 |
| 7 | 10880097 | 0.502530 | 0.00347805 | 18.5987 | 10880098 | -0.000444242 | 0.506452 | 18.6010 |