| Red | Green | Blue | |
| z | 17.63 | ||
| znorm | Inf | ||
| sky | -NaN | -NaN | -Inf |
| S/N | 29.9 | 47.5 | 52.8 |
| S/N(c) | 0.0 | 0.0 | 0.0 |
| SN(E/C) |
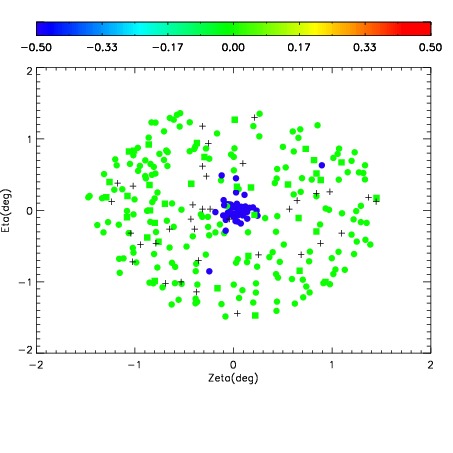
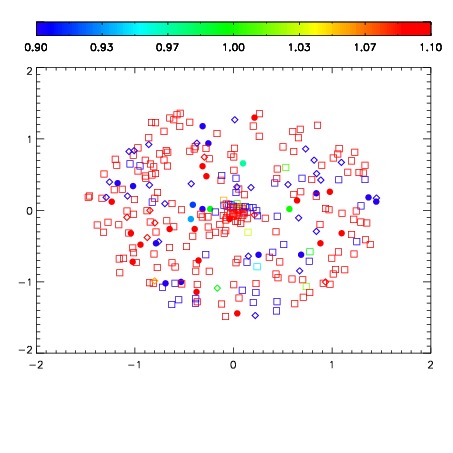
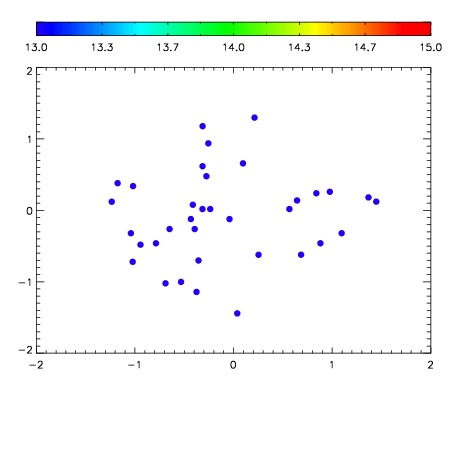

| Frame | Nreads | Zeropoints | Mag plots | Spatial mag deviation | Spatial sky 16325A emission deviations (filled: sky, open: star) | Spatial sky continuum emission | Spatial sky telluric CO2 absorption deviations (filled: H < 10) | |||||||||||||||||||||||
| 0 | 0 |
|
|
|
|
|
|
| IPAIR | NAME | SHIFT | NEWSHIFT | S/N | NAME | SHIFT | NEWSHIFT | S/N |
| 0 | 11090092 | 0.475865 | 0.00000 | 18.4444 | 11090093 | -0.000376784 | 0.476242 | 18.5993 |
| 1 | 11090087 | 0.472903 | 0.00296199 | 18.8292 | 11090086 | 0.00000 | 0.475865 | 18.7654 |
| 2 | 11090088 | 0.473477 | 0.00238800 | 18.7429 | 11090089 | -0.000629646 | 0.476495 | 18.7341 |
| 3 | 11090091 | 0.475070 | 0.000795007 | 18.7429 | 11090090 | -0.000252353 | 0.476117 | 18.6474 |