| Red | Green | Blue | |
| z | 17.64 | ||
| znorm | Inf | ||
| sky | -Inf | -Inf | -NaN |
| S/N | 28.6 | 46.3 | 51.2 |
| S/N(c) | 0.0 | 0.0 | 0.0 |
| SN(E/C) |
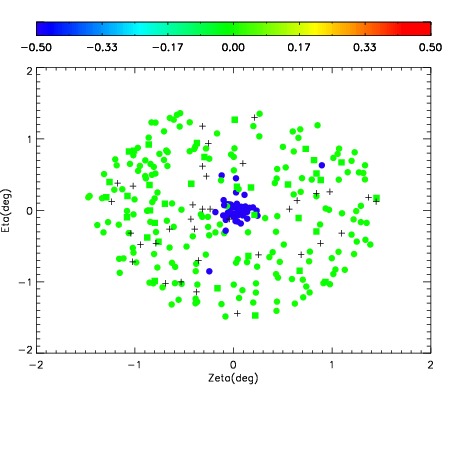
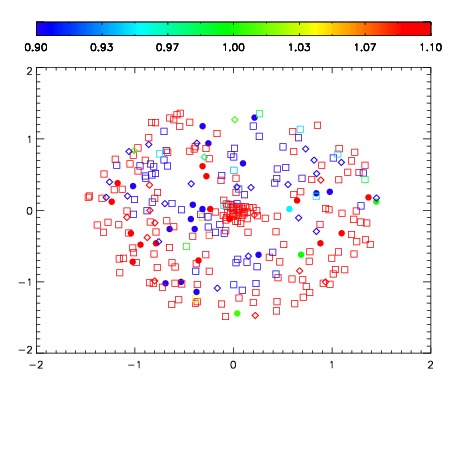
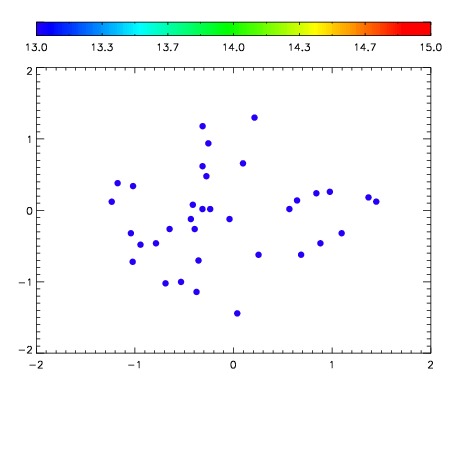

| Frame | Nreads | Zeropoints | Mag plots | Spatial mag deviation | Spatial sky 16325A emission deviations (filled: sky, open: star) | Spatial sky continuum emission | Spatial sky telluric CO2 absorption deviations (filled: H < 10) | |||||||||||||||||||||||
| 0 | 0 |
|
|
|
|
|
|
| IPAIR | NAME | SHIFT | NEWSHIFT | S/N | NAME | SHIFT | NEWSHIFT | S/N |
| 0 | 11160041 | 0.486371 | 0.00000 | 18.7447 | 11160042 | 0.00615416 | 0.480217 | 18.6676 |
| 1 | 11160040 | 0.485799 | 0.000571996 | 18.6597 | 11160039 | 0.000700666 | 0.485670 | 18.6487 |
| 2 | 11160037 | 0.485296 | 0.00107500 | 18.5107 | 11160035 | 0.00000 | 0.486371 | 18.4908 |
| 3 | 11160036 | 0.484247 | 0.00212401 | 18.3607 | 11160038 | 0.000449658 | 0.485921 | 18.4106 |