| Red | Green | Blue | |
| z | 17.64 | ||
| znorm | Inf | ||
| sky | -Inf | -Inf | -NaN |
| S/N | 26.7 | 43.7 | 47.5 |
| S/N(c) | 0.0 | 0.0 | 0.0 |
| SN(E/C) |

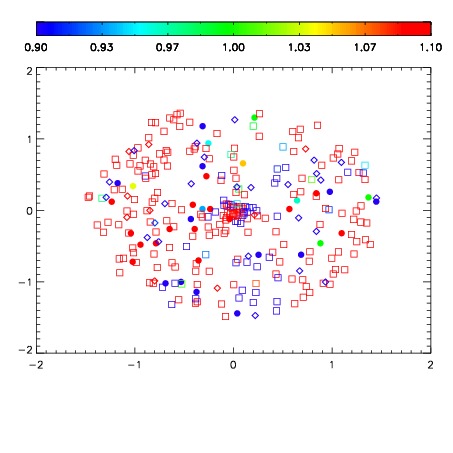


| Frame | Nreads | Zeropoints | Mag plots | Spatial mag deviation | Spatial sky 16325A emission deviations (filled: sky, open: star) | Spatial sky continuum emission | Spatial sky telluric CO2 absorption deviations (filled: H < 10) | |||||||||||||||||||||||
| 0 | 0 |
|
|
|
|
|
|
| IPAIR | NAME | SHIFT | NEWSHIFT | S/N | NAME | SHIFT | NEWSHIFT | S/N |
| 0 | 11450024 | 0.478327 | 0.00000 | 18.4927 | 11450022 | 0.00000 | 0.478327 | 18.6032 |
| 1 | 11450027 | 0.475954 | 0.00237301 | 18.8269 | 11450026 | -0.000708373 | 0.479035 | 18.8539 |
| 2 | 11450028 | 0.476631 | 0.00169602 | 18.6417 | 11450029 | 0.00102737 | 0.477300 | 18.7147 |
| 3 | 11450023 | 0.477893 | 0.000434011 | 18.4612 | 11450025 | -0.000351797 | 0.478679 | 18.5387 |