| Red | Green | Blue | |
| z | 17.64 | ||
| znorm | Inf | ||
| sky | -Inf | -Inf | -Inf |
| S/N | 50.6 | 78.3 | 86.8 |
| S/N(c) | 0.0 | 0.0 | 0.0 |
| SN(E/C) |
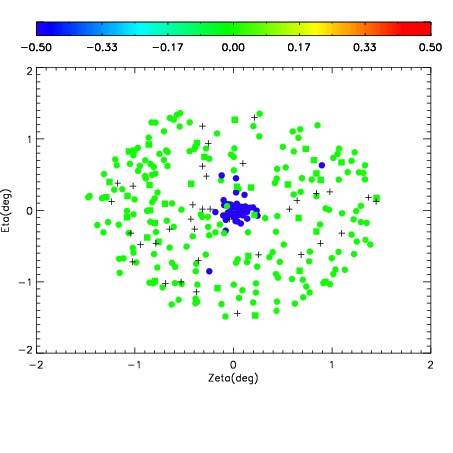
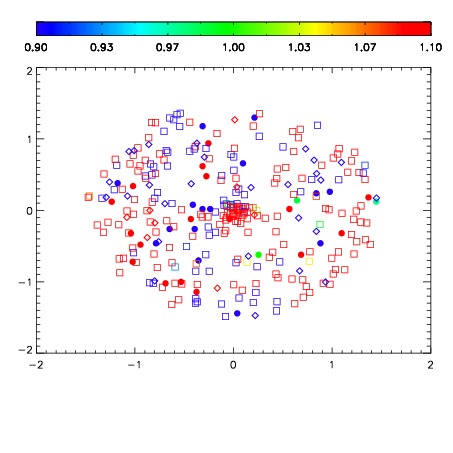
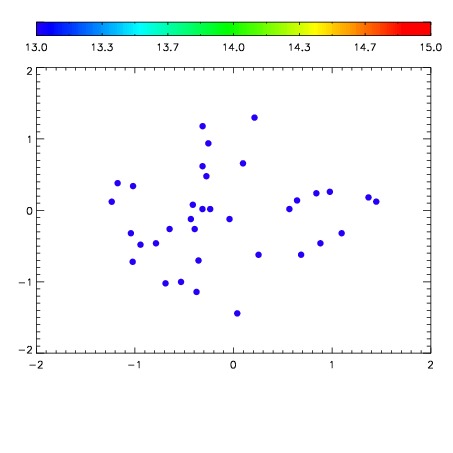

| Frame | Nreads | Zeropoints | Mag plots | Spatial mag deviation | Spatial sky 16325A emission deviations (filled: sky, open: star) | Spatial sky continuum emission | Spatial sky telluric CO2 absorption deviations (filled: H < 10) | |||||||||||||||||||||||
| 0 | 0 |
|
|
|
|
|
|
| IPAIR | NAME | SHIFT | NEWSHIFT | S/N | NAME | SHIFT | NEWSHIFT | S/N |
| 0 | 11650024 | 0.494376 | 0.00000 | 19.0564 | 11650029 | -0.00218652 | 0.496563 | 19.0469 |
| 1 | 11650035 | 0.493796 | 0.000580013 | 19.1427 | 11650034 | -0.00130057 | 0.495677 | 19.1615 |
| 2 | 11650032 | 0.493384 | 0.000992000 | 19.1341 | 11650033 | -0.00129734 | 0.495673 | 19.1521 |
| 3 | 11650031 | 0.493538 | 0.000838012 | 19.0841 | 11650030 | -0.00181260 | 0.496189 | 19.1400 |
| 4 | 11650023 | 0.494271 | 0.000104994 | 19.0689 | 11650022 | 0.00000 | 0.494376 | 19.0713 |
| 5 | 11650028 | 0.493392 | 0.000984013 | 19.0658 | 11650025 | -0.00119644 | 0.495572 | 19.0586 |
| 6 | 11650027 | 0.493358 | 0.00101802 | 18.9209 | 11650026 | -0.000796111 | 0.495172 | 18.7805 |