| Red | Green | Blue | |
| z | 17.64 | ||
| znorm | Inf | ||
| sky | -Inf | -Inf | -Inf |
| S/N | 36.7 | 56.6 | 62.6 |
| S/N(c) | 0.0 | 0.0 | 0.0 |
| SN(E/C) |
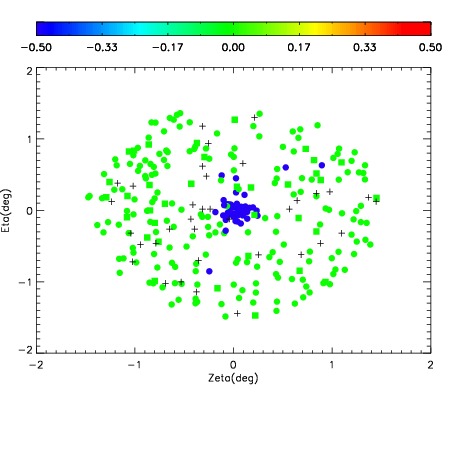
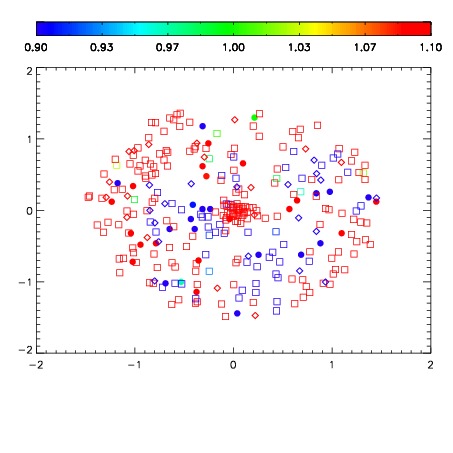
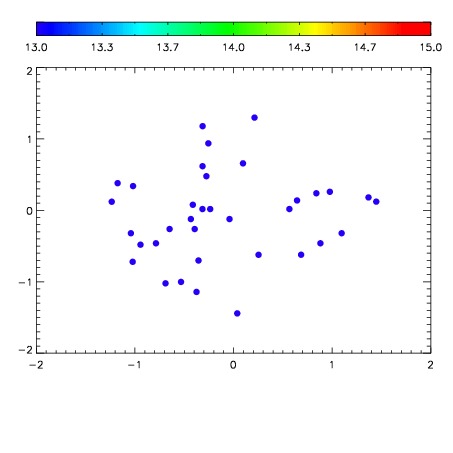

| Frame | Nreads | Zeropoints | Mag plots | Spatial mag deviation | Spatial sky 16325A emission deviations (filled: sky, open: star) | Spatial sky continuum emission | Spatial sky telluric CO2 absorption deviations (filled: H < 10) | |||||||||||||||||||||||
| 0 | 0 |
|
|
|
|
|
|
| IPAIR | NAME | SHIFT | NEWSHIFT | S/N | NAME | SHIFT | NEWSHIFT | S/N |
| 0 | 12030012 | 0.502123 | 0.00000 | 18.9325 | 12030015 | -0.00231221 | 0.504435 | 18.9169 |
| 1 | 12030017 | 0.501779 | 0.000343978 | 19.0031 | 12030014 | -0.00250113 | 0.504624 | 18.9314 |
| 2 | 12030016 | 0.501561 | 0.000562012 | 18.9526 | 12030011 | 0.00000 | 0.502123 | 18.9206 |
| 3 | 12030013 | 0.501491 | 0.000631988 | 18.8916 | 12030018 | -0.00112555 | 0.503249 | 18.8961 |