| Red | Green | Blue | |
| z | 17.64 | ||
| znorm | Inf | ||
| sky | -Inf | -Inf | -Inf |
| S/N | 40.9 | 65.3 | 71.9 |
| S/N(c) | 0.0 | 0.0 | 0.0 |
| SN(E/C) |
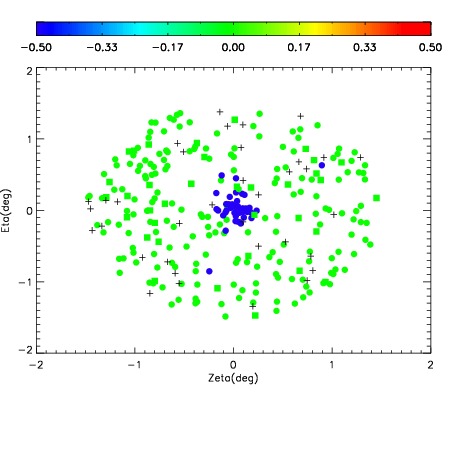
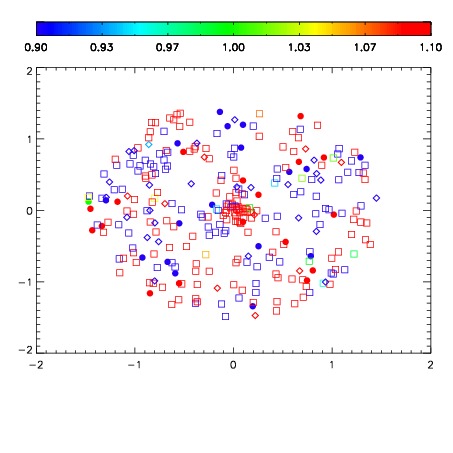


| Frame | Nreads | Zeropoints | Mag plots | Spatial mag deviation | Spatial sky 16325A emission deviations (filled: sky, open: star) | Spatial sky continuum emission | Spatial sky telluric CO2 absorption deviations (filled: H < 10) | |||||||||||||||||||||||
| 0 | 0 |
|
|
|
|
|
|
| IPAIR | NAME | SHIFT | NEWSHIFT | S/N | NAME | SHIFT | NEWSHIFT | S/N |
| 0 | 10890109 | 0.511724 | 0.00000 | 18.6154 | 10890104 | -0.00264598 | 0.514370 | 18.5912 |
| 1 | 10890098 | 0.507806 | 0.00391799 | 19.0108 | 10890100 | -0.00450945 | 0.516233 | 18.9499 |
| 2 | 10890101 | 0.507972 | 0.00375199 | 18.9171 | 10890099 | -0.00441291 | 0.516137 | 18.9446 |
| 3 | 10890097 | 0.507238 | 0.00448602 | 18.9083 | 10890096 | 0.00000 | 0.511724 | 18.8729 |
| 4 | 10890105 | 0.509523 | 0.00220102 | 18.6756 | 10890107 | -0.00112205 | 0.512846 | 18.7692 |
| 5 | 10890106 | 0.509417 | 0.00230700 | 18.6567 | 10890108 | -0.000110435 | 0.511834 | 18.6949 |
| 6 | 10890102 | 0.508752 | 0.00297201 | 18.5499 | 10890103 | -0.00357307 | 0.515297 | 18.5089 |