| Red | Green | Blue | |
| z | 17.64 | ||
| znorm | Inf | ||
| sky | -Inf | -Inf | -Inf |
| S/N | 36.7 | 56.6 | 63.9 |
| S/N(c) | 0.0 | 0.0 | 0.0 |
| SN(E/C) |
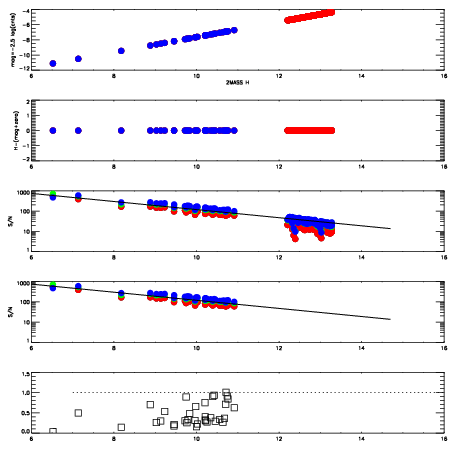
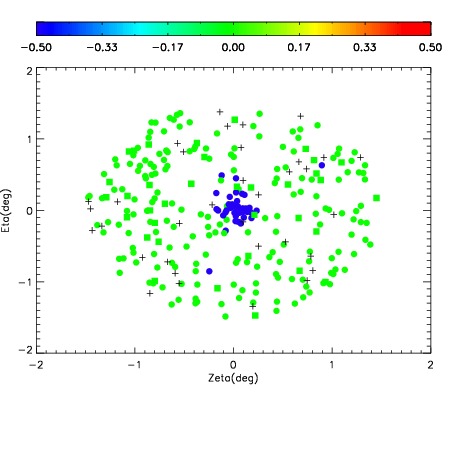
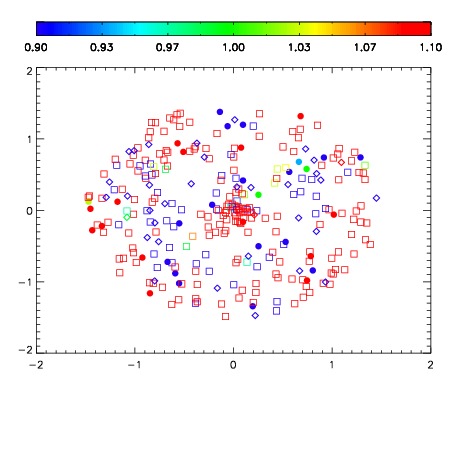
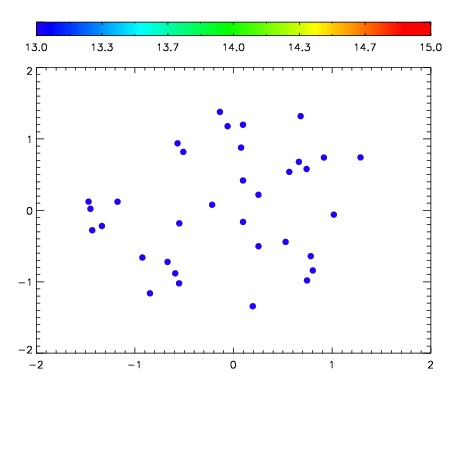

| Frame | Nreads | Zeropoints | Mag plots | Spatial mag deviation | Spatial sky 16325A emission deviations (filled: sky, open: star) | Spatial sky continuum emission | Spatial sky telluric CO2 absorption deviations (filled: H < 10) | |||||||||||||||||||||||
| 0 | 0 |
|
|
|
|
|
|
| IPAIR | NAME | SHIFT | NEWSHIFT | S/N | NAME | SHIFT | NEWSHIFT | S/N |
| 0 | 11410061 | 0.480196 | 0.00000 | 19.0656 | 11410062 | 0.000591173 | 0.479605 | 19.0411 |
| 1 | 11410060 | 0.479847 | 0.000348985 | 19.0843 | 11410059 | -0.000934436 | 0.481130 | 19.0679 |
| 2 | 11410056 | 0.478995 | 0.00120100 | 18.9962 | 11410055 | 0.00000 | 0.480196 | 18.9892 |
| 3 | 11410057 | 0.478847 | 0.00134900 | 18.9258 | 11410058 | -0.00126593 | 0.481462 | 18.9763 |