| Red | Green | Blue | |
| z | 17.64 | ||
| znorm | Inf | ||
| sky | -Inf | -NaN | -Inf |
| S/N | 21.8 | 41.8 | 42.6 |
| S/N(c) | 17.7 | 42.3 | 10.4 |
| SN(E/C) |
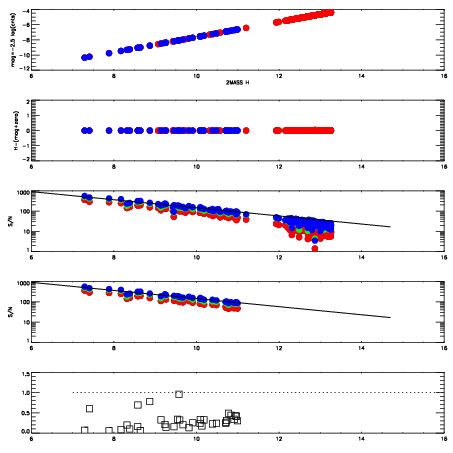
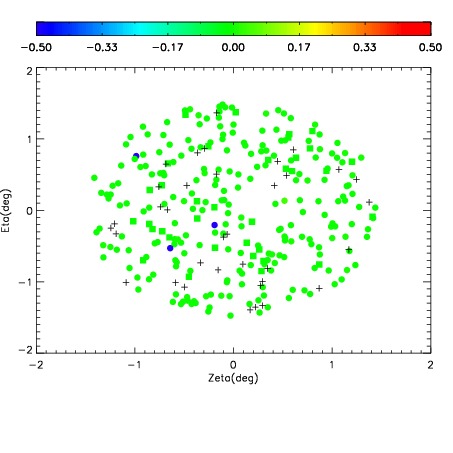
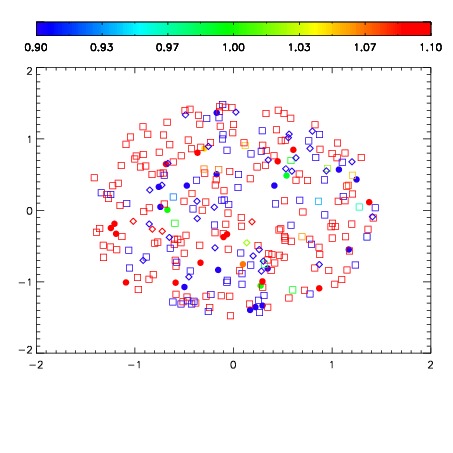
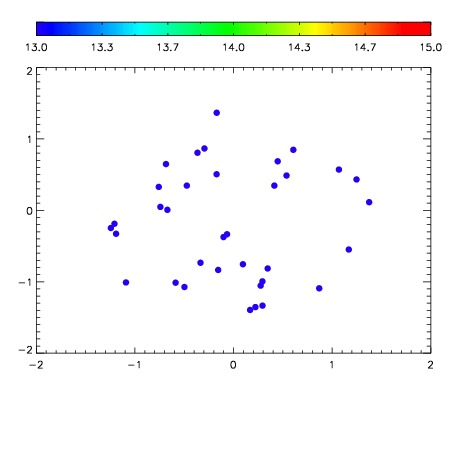

| Frame | Nreads | Zeropoints | Mag plots | Spatial mag deviation | Spatial sky 16325A emission deviations (filled: sky, open: star) | Spatial sky continuum emission | Spatial sky telluric CO2 absorption deviations (filled: H < 10) | |||||||||||||||||||||||
| 0 | 0 |
|
|
|
|
|
|
| IPAIR | NAME | SHIFT | NEWSHIFT | S/N | NAME | SHIFT | NEWSHIFT | S/N |
| 0 | 11110091 | 0.486092 | 0.00000 | 18.1697 | 11110089 | -0.000414021 | 0.486506 | 18.1614 |
| 1 | 11110086 | 0.481312 | 0.00477999 | 18.6446 | 11110084 | -0.00142927 | 0.487521 | 18.4881 |
| 2 | 11110082 | 0.480565 | 0.00552699 | 18.6004 | 11110085 | -0.00160159 | 0.487694 | 18.4854 |
| 3 | 11110083 | 0.480728 | 0.00536400 | 18.5118 | 11110081 | 0.00000 | 0.486092 | 18.4253 |
| 4 | 11110087 | 0.482767 | 0.00332502 | 18.2971 | 11110088 | -0.000430718 | 0.486523 | 18.4185 |
| 5 | 11110090 | 0.485198 | 0.000894010 | 18.2274 | 11110092 | 0.00100367 | 0.485088 | 18.3480 |