| Red | Green | Blue | |
| z | 17.64 | ||
| znorm | Inf | ||
| sky | -Inf | -Inf | -Inf |
| S/N | 25.6 | 44.2 | 47.2 |
| S/N(c) | 44.4 | 94.4 | 41.0 |
| SN(E/C) |

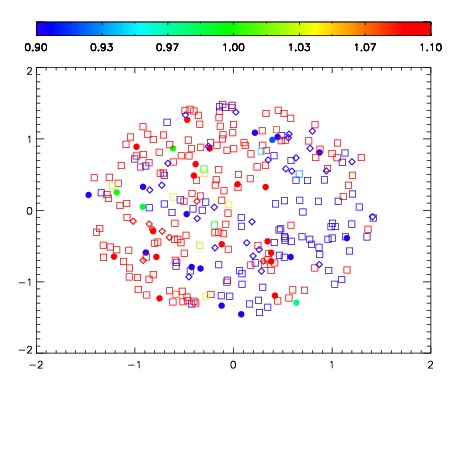
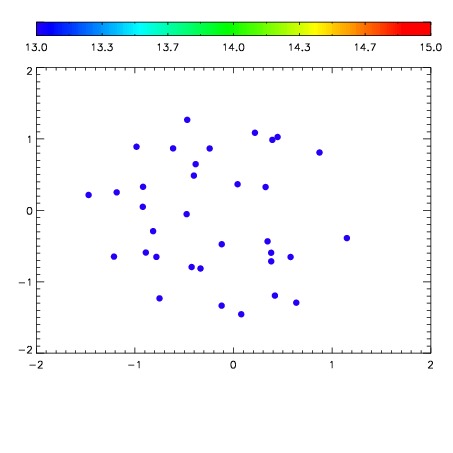

| Frame | Nreads | Zeropoints | Mag plots | Spatial mag deviation | Spatial sky 16325A emission deviations (filled: sky, open: star) | Spatial sky continuum emission | Spatial sky telluric CO2 absorption deviations (filled: H < 10) | |||||||||||||||||||||||
| 0 | 0 |
|
|
|
|
|
|
| IPAIR | NAME | SHIFT | NEWSHIFT | S/N | NAME | SHIFT | NEWSHIFT | S/N |
| 0 | 12680017 | 0.489510 | 0.00000 | 18.9871 | 12680011 | 0.00000 | 0.489510 | 18.9751 |
| 1 | 12680016 | 0.489162 | 0.000348002 | 18.9874 | 12680015 | -0.00276876 | 0.492279 | 18.9884 |
| 2 | 12680012 | 0.488964 | 0.000546008 | 18.9845 | 12680018 | -7.73026e-05 | 0.489587 | 18.9651 |
| 3 | 12680013 | 0.488472 | 0.00103799 | 18.9740 | 12680014 | -0.00259266 | 0.492103 | 18.9200 |